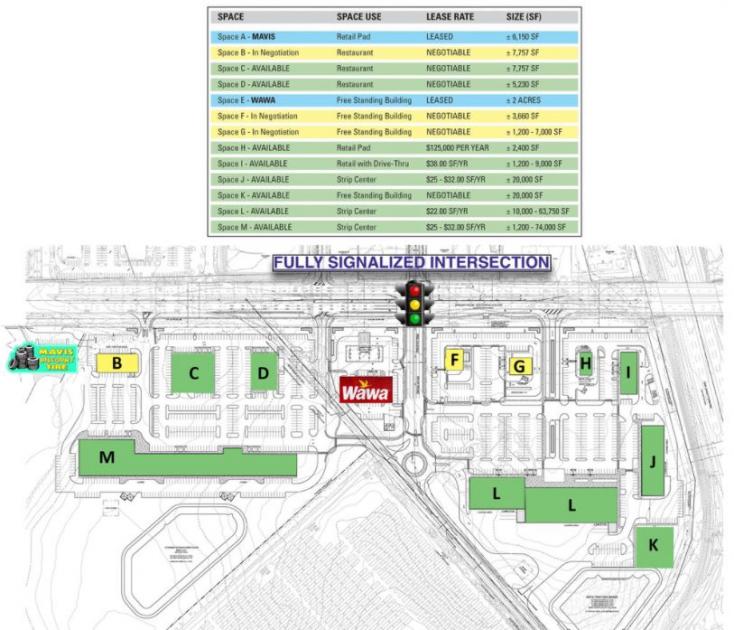
Retail Space
2035 Burlington - Mount Holly Road Westampton, NJ 08060
2035 Burlington - Mount Holly Road Westampton, NJ 08060
Details & Description
Property Highlights
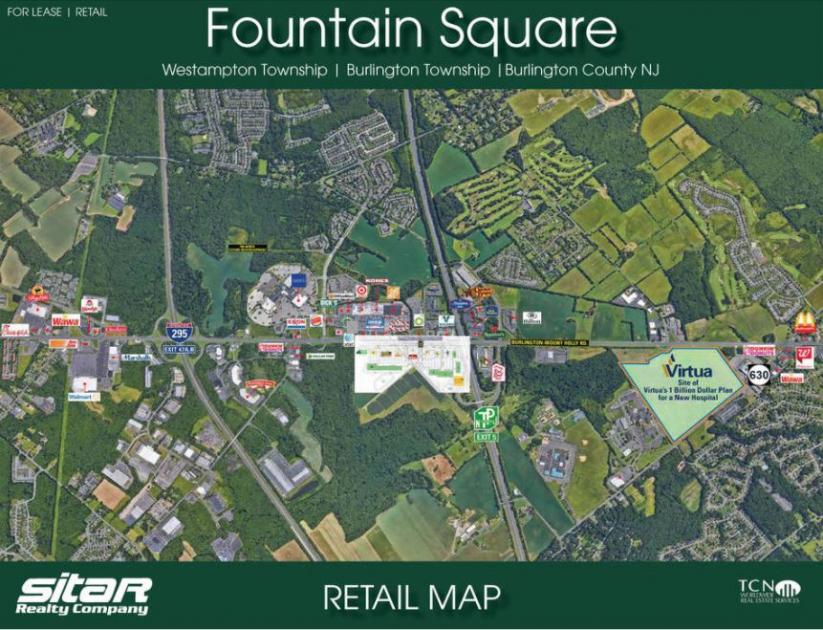
• In area of tremendous amount of residential development, including 200 units behind Home Depot
• Less than one mile from the proposed $1 Billion Virtua Healths Westampton medical campus
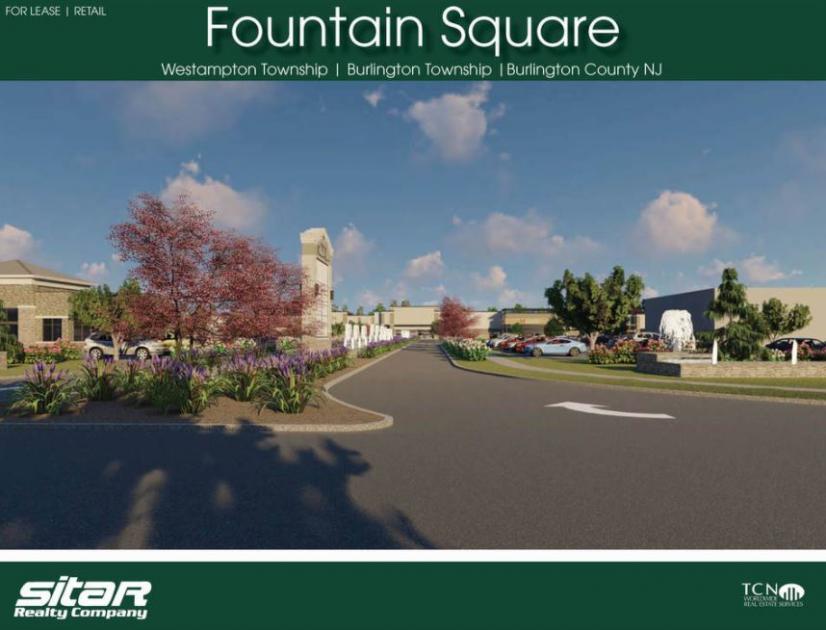
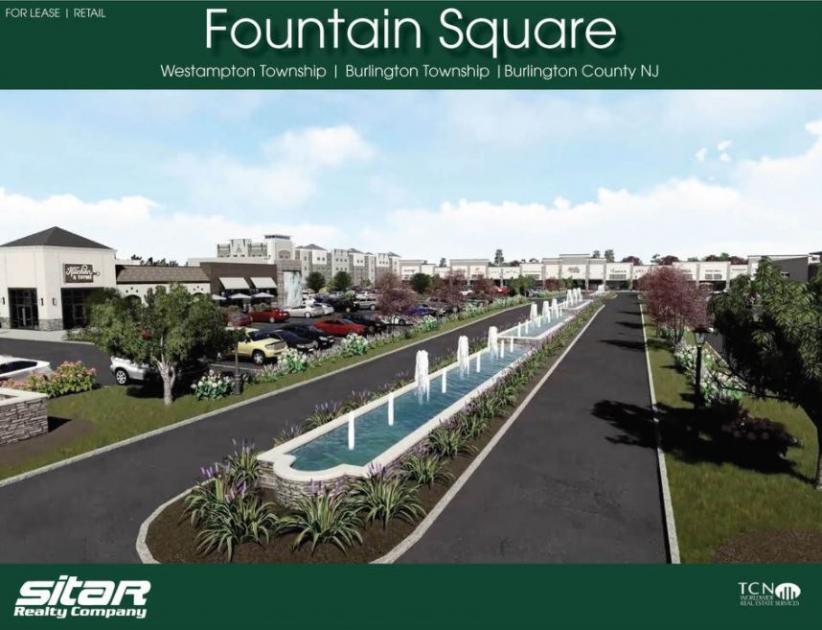
Additional Photos
Listing Agents

Giorgio Vasillis
O: 732-449-2000
M: 732-579-7002
vasilis@sitarcompany.com
O: 732-449-2000
M: 732-579-7002
vasilis@sitarcompany.com
While we strive to provide the most accurate information, all listing information, and demographic data, is provided by third-parties. As such, MyEListing will not be responsible for the accuracy of the information. It is strongly recommended that you verify all information with the listing agent, and any relevant agencies, prior to making any decisions.


