Retail Space
861 Pennsylvania 100 Allentown, PA 18106
861 Pennsylvania 100 Allentown, PA 18106
Details & Description
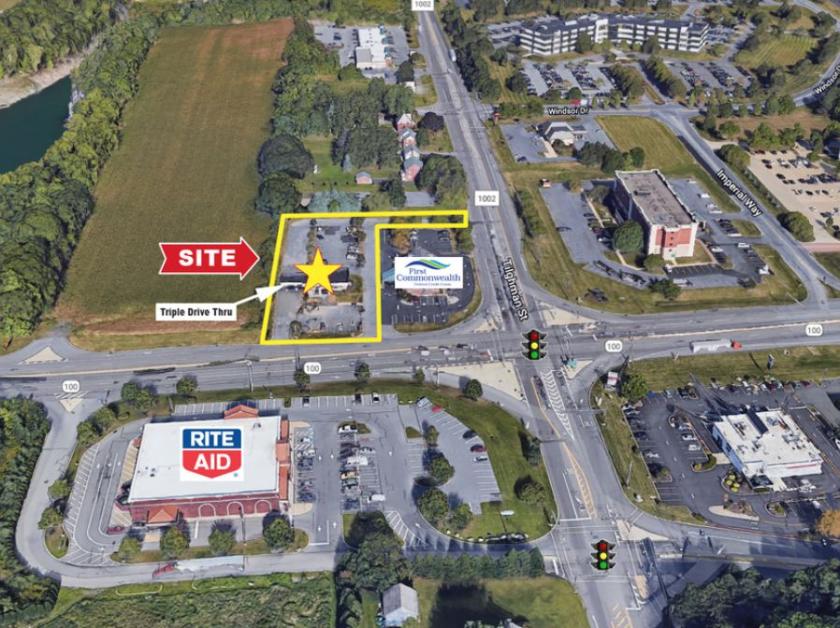
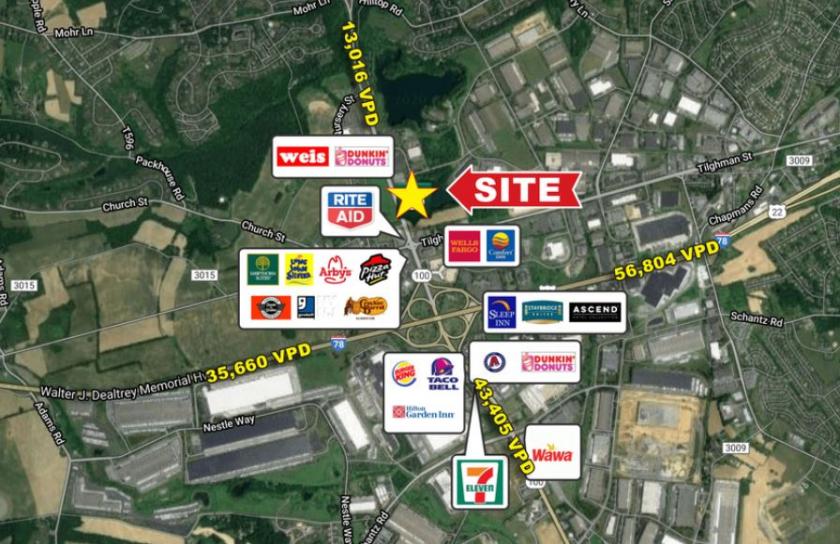
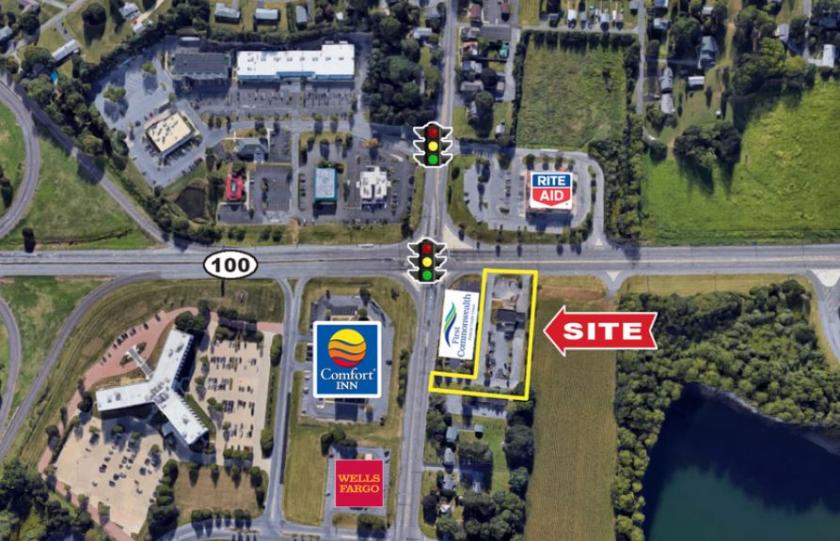
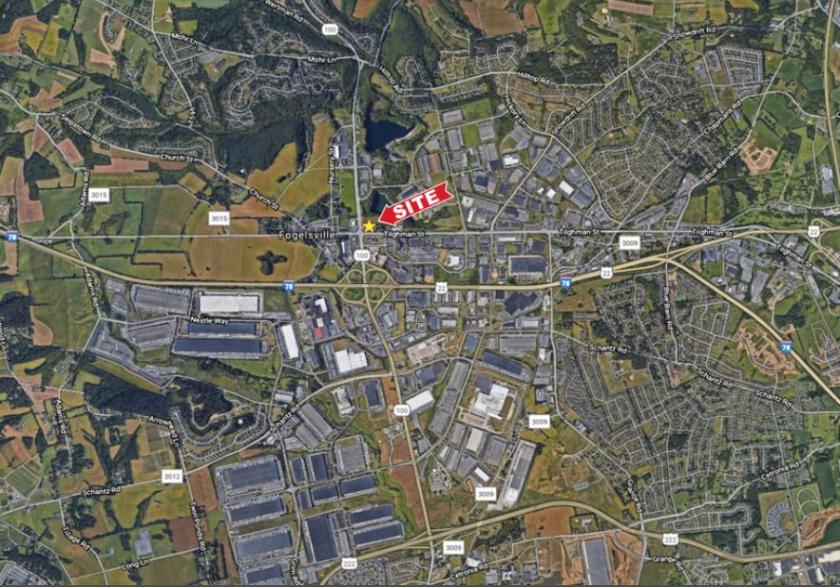
Property Highlights
- • Zoned NC Neighborhood Commercial District
- • Traffic count of 26,672 VPD 2019
- • 39 parking spaces
- • Taxes $16,212.32 2020
Additional Photos
Listing Agents

Giorgio Vasillis
O: 732-449-2000
M: 732-579-7002
vasilis@sitarcompany.com
O: 732-449-2000
M: 732-579-7002
vasilis@sitarcompany.com
While we strive to provide the most accurate information, all listing information, and demographic data, is provided by third-parties. As such, MyEListing will not be responsible for the accuracy of the information. It is strongly recommended that you verify all information with the listing agent, and any relevant agencies, prior to making any decisions.


