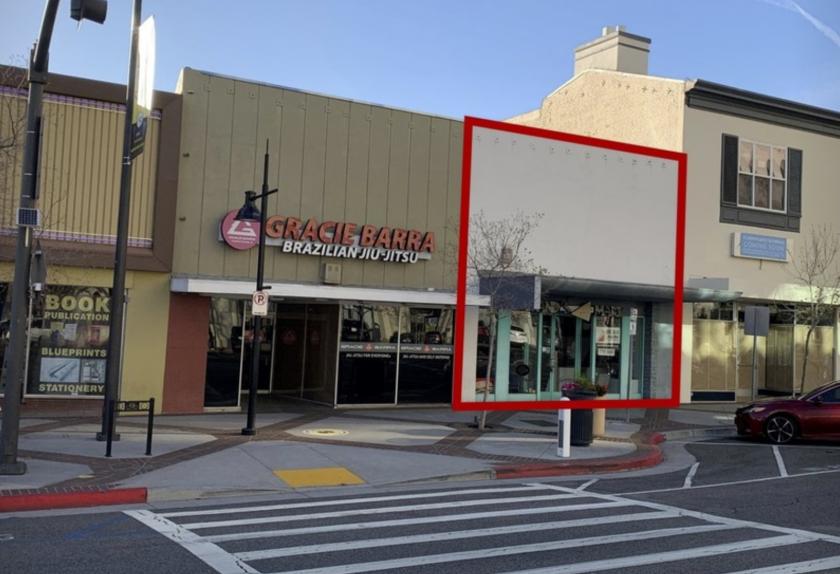
1-Mile | 3-Miles | 5-Miles | ||
---|---|---|---|---|
Total Population | 67,453 | 221,287 | 552,356 | |
Population Median Age | 41 | 41 | 40 | |
Population by Age | 0-9 Yrs | 6660 (9%) | 21969 (9%) | 52882 (9%) |
10-19 Yrs | 5421 (8%) | 19809 (8%) | 50344 (9%) | |
20-29 Yrs | 10299 (15%) | 31502 (14%) | 81581 (14%) | |
30-39 Yrs | 11552 (17%) | 35824 (16%) | 94994 (17%) | |
40-49 Yrs | 8658 (12%) | 29243 (13%) | 77553 (14%) | |
50-59 Yrs | 8790 (13%) | 31245 (14%) | 75659 (13%) | |
60-69 Yrs | 7411 (10%) | 24922 (11%) | 59866 (10%) | |
70+ Yrs | 8662 (12%) | 26772 (12%) | 59477 (10%) | |
Median HH Income | $55,132 | $65,382 | $69,004 | |
Total Household Income | < 24K | 7411 (27%) | 18657 (22%) | 43205 (20%) |
25-49K | 4923 (18%) | 14600 (17%) | 37984 (17%) | |
50-74K | 4483 (16%) | 12929 (15%) | 33157 (15%) | |
75-99K | 2984 (11%) | 9462 (11%) | 24463 (11%) | |
100-199K | 5428 (20%) | 19234 (23%) | 49961 (23%) | |
200K+ | 1318 (4%) | 7903 (9%) | 24416 (11%) | |
Highest Education Level | No Diploma | 7259 | 23573 | 59170 |
Diploma or GED | 12262 | 34136 | 75823 | |
Some College | 7265 | 26155 | 70971 | |
Assoc. Degree | 5792 | 16570 | 33933 | |
Bachelors Degree | 12445 | 43438 | 116677 | |
Higher Degree | 6214 | 22740 | 61329 | |
Total Housing Units | 28,226 | 87,898 | 228,781 | |
--Owner-Occupied | 4,286 | 25,026 | 74,333 | |
--Renter-Occupied | 22,260 | 57,758 | 138,854 | |
Owner-Occupied Values | < 100K | 88 | 357 | 1051 |
100-199K | 35 | 149 | 656 | |
200-299K | 261 | 576 | 1138 | |
300-399K | 682 | 1575 | 3444 | |
400-499K | 961 | 2245 | 5671 | |
500K+ | 2259 | 20125 | 62372 | |
Total Working Age Population | 57,490 | 187,216 | 469,556 | |
In Work Force | 36,231 | 119,795 | 313,497 | |
Not In Work Force | 21,259 | 67,420 | 156,058 | |
Workforce Employed | 33,915 | 111,882 | 293,022 | |
Workforce Unemployed | 2,289 | 7,723 | 20,192 | |
Civlian Workforce | 36,205 | 119,605 | 313,214 | |
Military Workforce | 27 | 191 | 284 | |
Total Households | 26,547 | 82,784 | 213,187 | |
Family Households | 16,392 | 53,382 | 124,623 | |
Non-Family Households | 10,155 | 29,402 | 88,564 | |
Married Couple | 11,070 | 37,848 | 88,770 | |
Other Family | 5,321 | 15,535 | 35,853 | |
Married w/Child | 4,385 | 15,080 | 34,304 | |
Single Male w/Child | 332 | 1,195 | 3,430 | |
Single Female w/Child | 1,190 | 3,197 | 8,758 |
Population Change Last Two Decades - Plus Projection
2000 | % | 2010 | % | 2020 | % | 2030 | |
---|---|---|---|---|---|---|---|
California | 33,871,648 | +10 | 37,253,956 | +9 | 40,467,295 | +8 | 43,631,295 |
Los Angeles County | 9,519,338 | +3 | 9,818,605 | +6 | 10,369,367 | +4 | 10,759,850 |
Total Working Age Population:
Total Households:
Total Working Age Population:
Total Households:
Total Working Age Population:
Total Households: