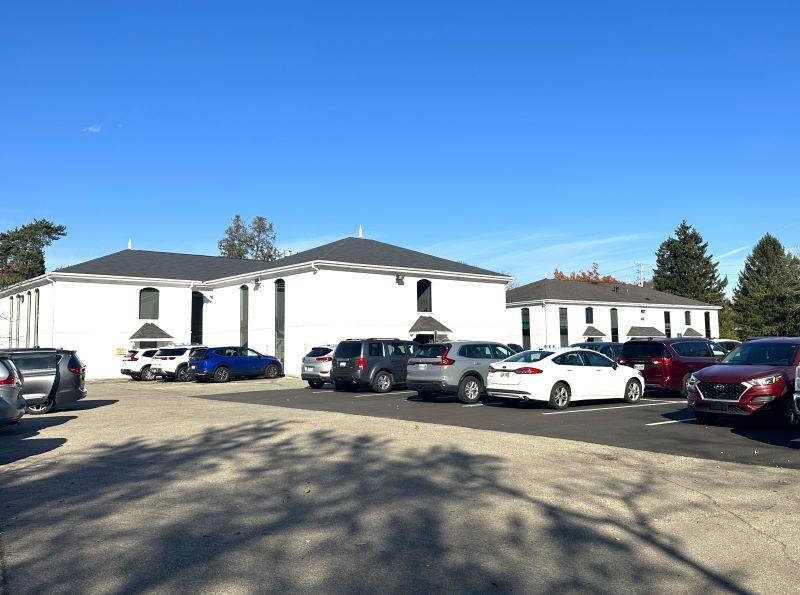
1-Mile | 3-Miles | 5-Miles | ||
---|---|---|---|---|
Total Population | 7,021 | 73,027 | 189,020 | |
Population Median Age | 45 | 43 | 41 | |
Population by Age | 0-9 Yrs | 695 (9%) | 8173 (11%) | 20648 (10%) |
10-19 Yrs | 687 (9%) | 7419 (10%) | 23277 (12%) | |
20-29 Yrs | 757 (10%) | 8741 (11%) | 26944 (14%) | |
30-39 Yrs | 762 (10%) | 9436 (12%) | 24016 (12%) | |
40-49 Yrs | 639 (9%) | 7490 (10%) | 20902 (11%) | |
50-59 Yrs | 1085 (15%) | 9772 (13%) | 23779 (12%) | |
60-69 Yrs | 1034 (14%) | 10120 (13%) | 24402 (12%) | |
70+ Yrs | 1362 (19%) | 11877 (16%) | 25052 (13%) | |
Median HH Income | $74,772 | $66,811 | $63,832 | |
Total Household Income | < 24K | 400 (13%) | 5166 (15%) | 14572 (17%) |
25-49K | 542 (17%) | 7231 (22%) | 17609 (21%) | |
50-74K | 573 (18%) | 5680 (17%) | 14494 (17%) | |
75-99K | 433 (14%) | 4751 (14%) | 11446 (14%) | |
100-199K | 850 (28%) | 7736 (23%) | 18073 (22%) | |
200K+ | 223 (7%) | 2184 (6%) | 5167 (6%) | |
Highest Education Level | No Diploma | 136 | 2430 | 7170 |
Diploma or GED | 968 | 10222 | 27796 | |
Some College | 1148 | 12470 | 30268 | |
Assoc. Degree | 428 | 5222 | 12643 | |
Bachelors Degree | 1458 | 12997 | 30606 | |
Higher Degree | 1046 | 10364 | 23442 | |
Total Housing Units | 3,204 | 34,816 | 88,055 | |
--Owner-Occupied | 2,325 | 22,007 | 52,050 | |
--Renter-Occupied | 697 | 10,741 | 29,313 | |
Owner-Occupied Values | < 100K | 144 | 3232 | 12084 |
100-199K | 1234 | 11808 | 23746 | |
200-299K | 739 | 4620 | 10048 | |
300-399K | 128 | 1227 | 3388 | |
400-499K | 43 | 653 | 1378 | |
500K+ | 37 | 467 | 1406 | |
Total Working Age Population | 5,904 | 60,180 | 155,182 | |
In Work Force | 3,744 | 38,482 | 98,773 | |
Not In Work Force | 2,161 | 21,698 | 56,409 | |
Workforce Employed | 3,652 | 36,963 | 93,819 | |
Workforce Unemployed | 71 | 1,321 | 4,271 | |
Civlian Workforce | 3,723 | 38,284 | 98,090 | |
Military Workforce | 21 | 198 | 683 | |
Total Households | 3,022 | 32,749 | 81,363 | |
Family Households | 1,904 | 19,512 | 47,502 | |
Non-Family Households | 1,118 | 13,237 | 33,861 | |
Married Couple | 1,592 | 15,412 | 36,806 | |
Other Family | 312 | 4,100 | 10,696 | |
Married w/Child | 556 | 5,224 | 13,275 | |
Single Male w/Child | 34 | 477 | 1,556 | |
Single Female w/Child | 78 | 1,754 | 4,344 |
Population Change Last Two Decades - Plus Projection
2000 | % | 2010 | % | 2020 | % | 2030 | |
---|---|---|---|---|---|---|---|
Ohio | 11,353,140 | +2 | 11,536,504 | 0 | 11,574,870 | 0 | 11,615,100 |
Greene County | 147,886 | +9 | 161,573 | +2 | 164,940 | +1 | 165,780 |
Montgomery County | 559,062 | -4 | 535,153 | -4 | 513,830 | -3 | 496,650 |
Total Working Age Population:
Total Households:
Total Working Age Population:
Total Households:
Total Working Age Population:
Total Households: