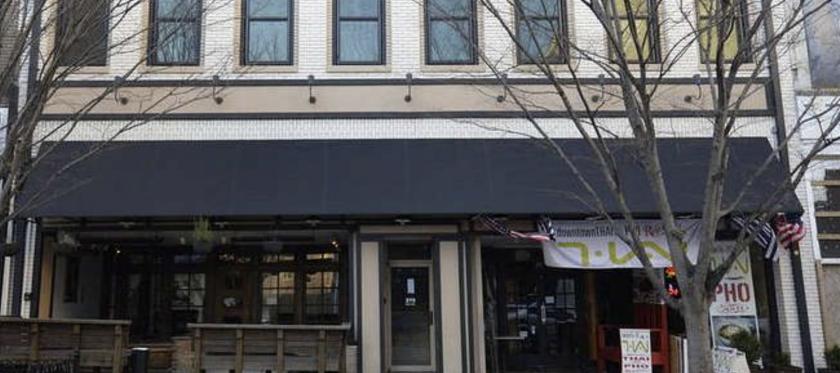
Office Space
271 West 4th Street WinstonSalem, NC 27101
271 West 4th Street WinstonSalem, NC 27101
Details & Description
Property Highlights
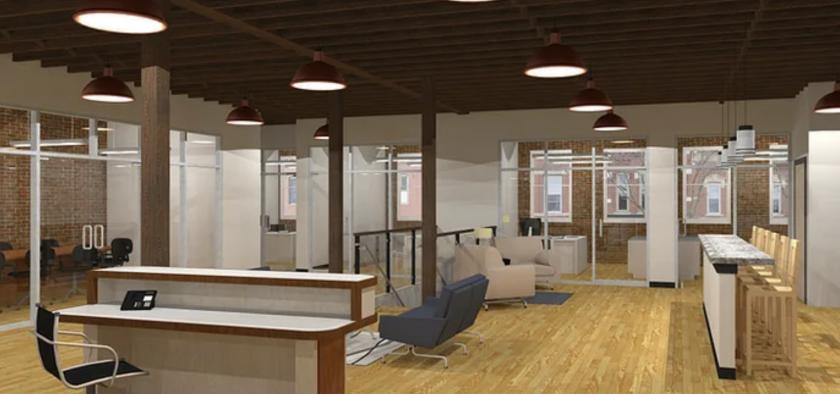
• Open floor plan with original hardwood floors, exposed ceilings, and new windows ready for custom buildout
• Recently renovated space in prime downtown location
Listing Agents

Tabitha Tisdale
O: 336-442-9495
tabitha@christophercommercialnc.com
O: 336-442-9495
tabitha@christophercommercialnc.com
While we strive to provide the most accurate information, all listing information, and demographic data, is provided by third-parties. As such, MyEListing will not be responsible for the accuracy of the information. It is strongly recommended that you verify all information with the listing agent, and any relevant agencies, prior to making any decisions.