Office Space
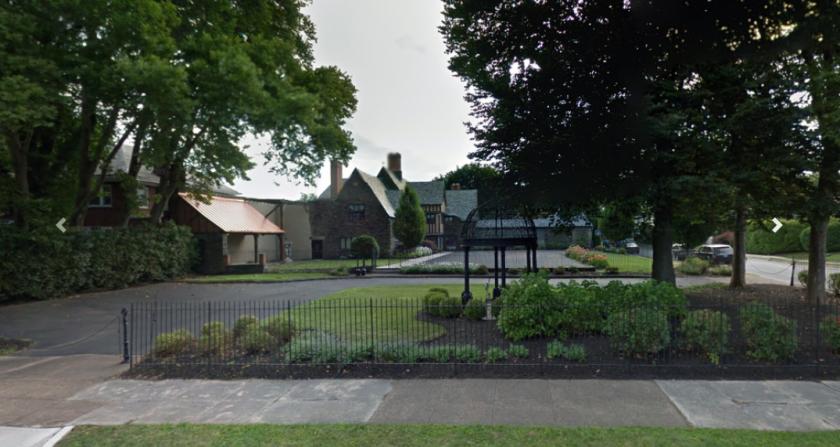
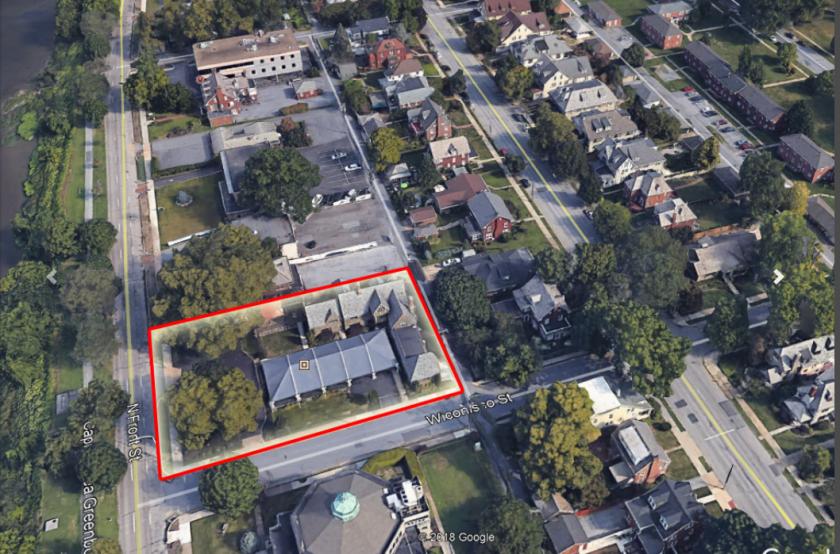
2701 North Front Street Harrisburg, PA 17110
2701 North Front Street Harrisburg, PA 17110
Details & Description
Property Highlights
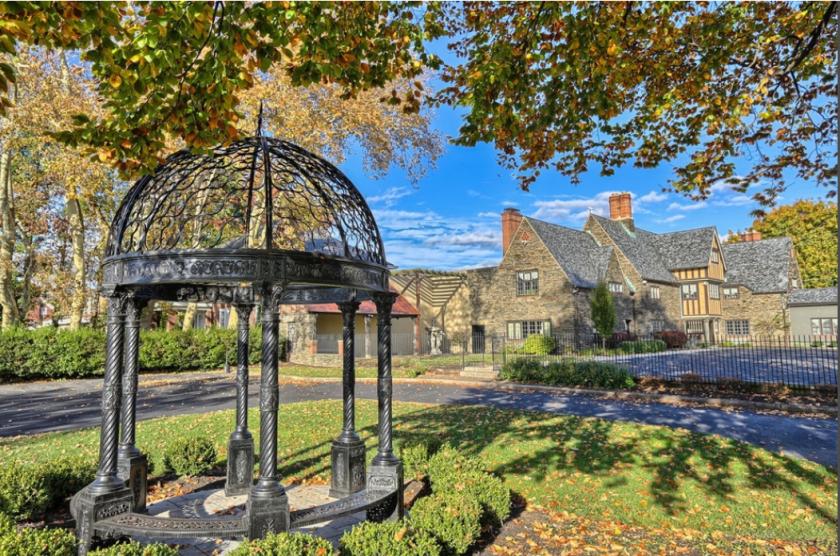
- • One of a kind landmark property
- • Beautiful office property
- • Potential to use as a wedding venue
- • Off street parking
Listing Agents

Drew Bobincheck
O: 717-731-1990
M: 717-877-4233
dbobincheck@landmarkcr.com
O: 717-731-1990
M: 717-877-4233
dbobincheck@landmarkcr.com
While we strive to provide the most accurate information, all listing information, and demographic data, is provided by third-parties. As such, MyEListing will not be responsible for the accuracy of the information. It is strongly recommended that you verify all information with the listing agent, and any relevant agencies, prior to making any decisions.