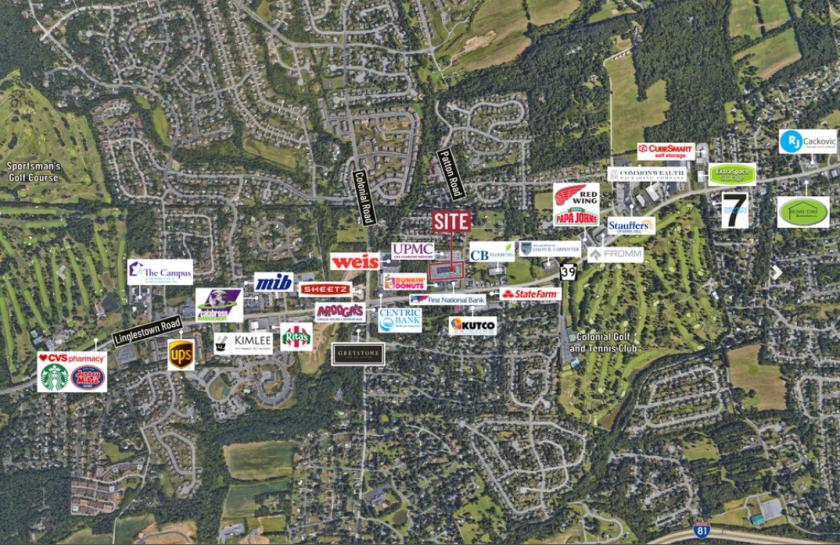
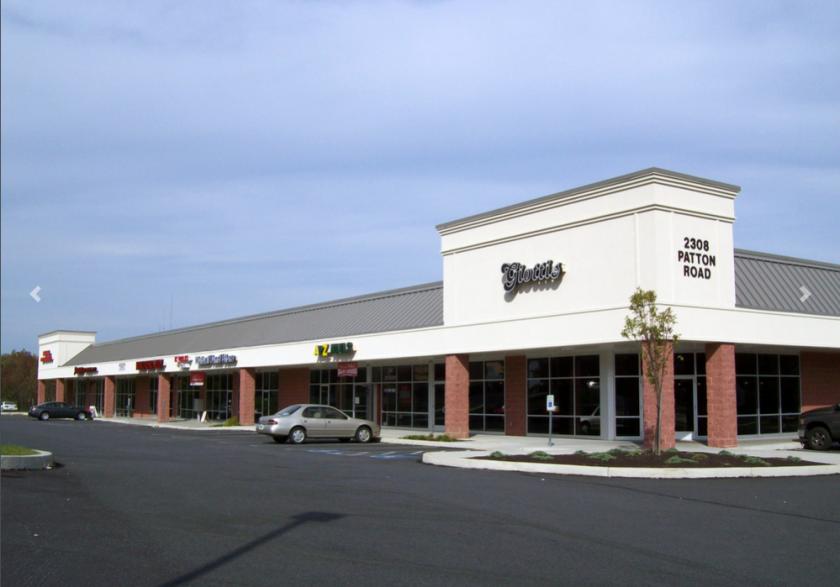
1-Mile | 3-Miles | 5-Miles | ||
---|---|---|---|---|
Total Population | 4,164 | 34,654 | 92,056 | |
Population Median Age | 43 | 41 | 40 | |
Population by Age | 0-9 Yrs | 457 (10%) | 4014 (11%) | 10878 (11%) |
10-19 Yrs | 553 (13%) | 3972 (11%) | 10810 (11%) | |
20-29 Yrs | 304 (7%) | 4190 (12%) | 12171 (13%) | |
30-39 Yrs | 501 (12%) | 4361 (12%) | 11827 (12%) | |
40-49 Yrs | 543 (13%) | 4805 (13%) | 11635 (12%) | |
50-59 Yrs | 567 (13%) | 4298 (12%) | 12252 (13%) | |
60-69 Yrs | 660 (15%) | 4845 (13%) | 12294 (13%) | |
70+ Yrs | 579 (13%) | 4169 (12%) | 10190 (11%) | |
Median HH Income | $103,930 | $76,092 | $66,315 | |
Total Household Income | < 24K | 117 (7%) | 1801 (12%) | 5835 (15%) |
25-49K | 225 (13%) | 2776 (19%) | 8390 (21%) | |
50-74K | 227 (13%) | 2531 (17%) | 7310 (18%) | |
75-99K | 211 (12%) | 2154 (14%) | 5631 (14%) | |
100-199K | 707 (42%) | 4148 (28%) | 9353 (24%) | |
200K+ | 169 (10%) | 994 (6%) | 2047 (5%) | |
Highest Education Level | No Diploma | 125 | 1296 | 4660 |
Diploma or GED | 518 | 7160 | 20809 | |
Some College | 574 | 4409 | 10632 | |
Assoc. Degree | 298 | 2576 | 6038 | |
Bachelors Degree | 874 | 5648 | 14309 | |
Higher Degree | 620 | 3652 | 8525 | |
Total Housing Units | 1,705 | 15,222 | 41,368 | |
--Owner-Occupied | 1,424 | 10,251 | 25,211 | |
--Renter-Occupied | 231 | 4,153 | 13,354 | |
Owner-Occupied Values | < 100K | 28 | 405 | 2284 |
100-199K | 287 | 4671 | 12695 | |
200-299K | 583 | 3255 | 6175 | |
300-399K | 387 | 1300 | 2500 | |
400-499K | 73 | 303 | 703 | |
500K+ | 66 | 318 | 854 | |
Total Working Age Population | 3,404 | 28,276 | 74,509 | |
In Work Force | 2,293 | 18,725 | 49,856 | |
Not In Work Force | 1,111 | 9,551 | 24,654 | |
Workforce Employed | 2,224 | 17,980 | 47,412 | |
Workforce Unemployed | 64 | 680 | 2,329 | |
Civlian Workforce | 2,289 | 18,660 | 49,740 | |
Military Workforce | 4 | 64 | 115 | |
Total Households | 1,655 | 14,404 | 38,566 | |
Family Households | 1,231 | 9,310 | 23,815 | |
Non-Family Households | 424 | 5,094 | 14,751 | |
Married Couple | 1,012 | 7,255 | 17,235 | |
Other Family | 219 | 2,055 | 6,580 | |
Married w/Child | 384 | 2,751 | 6,489 | |
Single Male w/Child | 70 | 318 | 767 | |
Single Female w/Child | 62 | 706 | 2,572 |
Population Change Last Two Decades - Plus Projection
2000 | % | 2010 | % | 2020 | % | 2030 | |
---|---|---|---|---|---|---|---|
Pennsylvania | 12,281,054 | +3 | 12,702,379 | +4 | 13,230,170 | +4 | 13,759,594 |
Cumberland County | 213,674 | +10 | 235,406 | +7 | 251,836 | +6 | 268,063 |
Dauphin County | 251,798 | +6 | 268,100 | +4 | 279,506 | +3 | 289,132 |
Perry County | 43,602 | +5 | 45,969 | +6 | 48,597 | +4 | 50,348 |
Total Working Age Population:
Total Households:
Total Working Age Population:
Total Households:
Total Working Age Population:
Total Households: