Office Space
555 Marin Street Thousand Oaks, CA 91360
555 Marin Street Thousand Oaks, CA 91360
Details & Description
Property Highlights
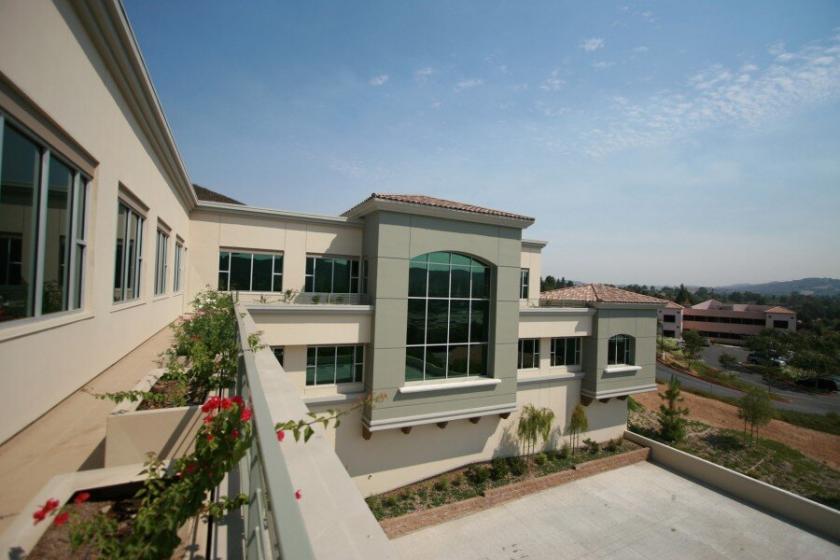
- • The most prestigious location in Thousand Oaks
- • Spectacular views of the Conejo Valley
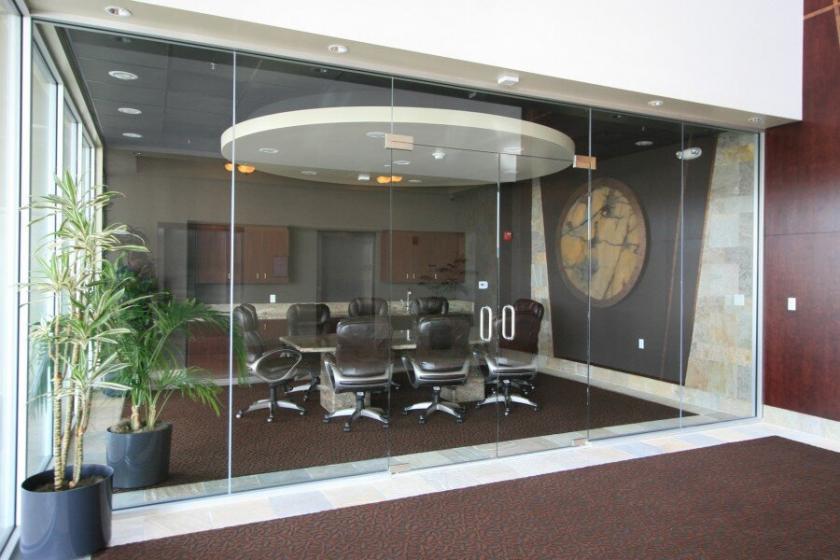
- • Highly efficient design with flexible suite sizes.
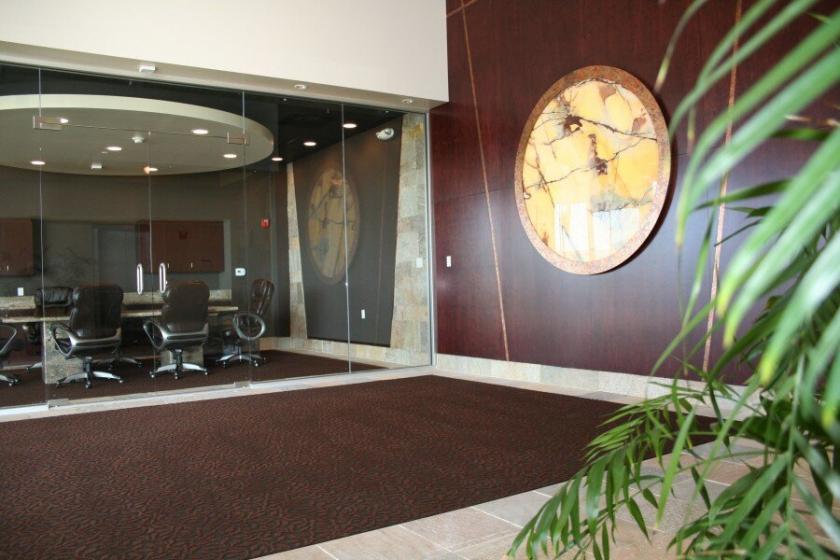
- • High end finishes on common areas.
- • Just a few minutes from Los Robles Hospital.
Listing Agents

Tony Principe
O: 805-497-4557
tony@westcord.com
O: 805-497-4557
tony@westcord.com
While we strive to provide the most accurate information, all listing information, and demographic data, is provided by third-parties. As such, MyEListing will not be responsible for the accuracy of the information. It is strongly recommended that you verify all information with the listing agent, and any relevant agencies, prior to making any decisions.