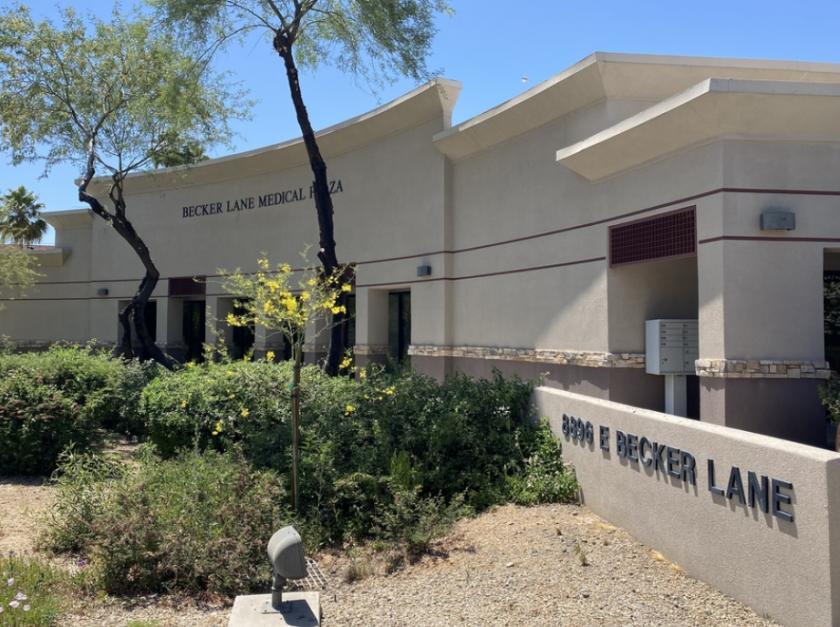
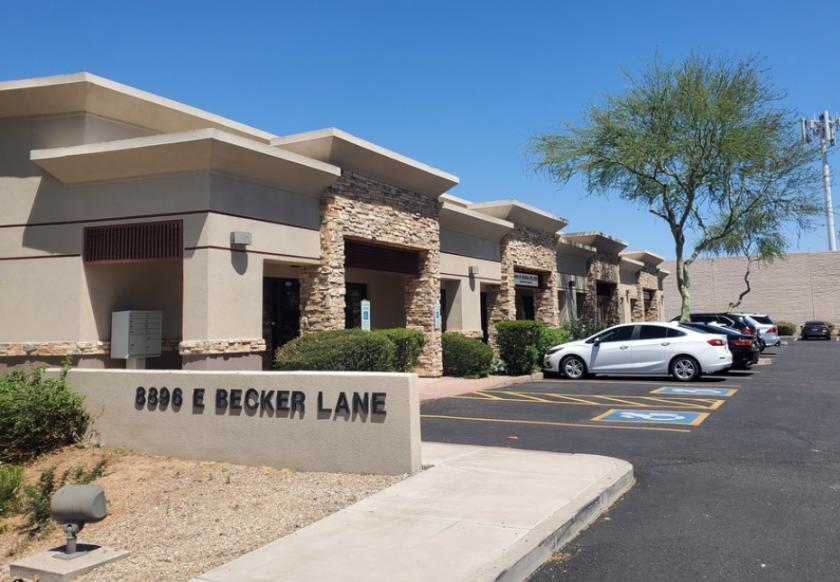
1-Mile | 3-Miles | 5-Miles | ||
---|---|---|---|---|
Total Population | 9,827 | 70,899 | 153,540 | |
Population Median Age | 50 | 46 | 45 | |
Population by Age | 0-9 Yrs | 692 (7%) | 5926 (8%) | 13547 (8%) |
10-19 Yrs | 918 (9%) | 6580 (9%) | 16023 (10%) | |
20-29 Yrs | 749 (7%) | 7404 (10%) | 15083 (9%) | |
30-39 Yrs | 793 (8%) | 7809 (11%) | 16658 (10%) | |
40-49 Yrs | 1063 (10%) | 8683 (12%) | 20290 (13%) | |
50-59 Yrs | 1193 (12%) | 10740 (15%) | 23599 (15%) | |
60-69 Yrs | 1855 (18%) | 10467 (14%) | 22374 (14%) | |
70+ Yrs | 2564 (26%) | 13289 (18%) | 25966 (16%) | |
Median HH Income | $73,332 | $90,820 | $95,532 | |
Total Household Income | < 24K | 784 (16%) | 3771 (11%) | 7431 (10%) |
25-49K | 886 (18%) | 4862 (14%) | 9946 (14%) | |
50-74K | 812 (16%) | 4968 (15%) | 9342 (13%) | |
75-99K | 659 (13%) | 4480 (13%) | 8876 (13%) | |
100-199K | 1143 (23%) | 9199 (27%) | 19042 (27%) | |
200K+ | 589 (12%) | 5592 (17%) | 13382 (19%) | |
Highest Education Level | No Diploma | 289 | 1236 | 2954 |
Diploma or GED | 1261 | 6842 | 14150 | |
Some College | 1205 | 10019 | 21888 | |
Assoc. Degree | 601 | 4074 | 8059 | |
Bachelors Degree | 2725 | 18509 | 40717 | |
Higher Degree | 1778 | 14192 | 29505 | |
Total Housing Units | 5,960 | 38,980 | 80,181 | |
--Owner-Occupied | 3,387 | 22,101 | 47,288 | |
--Renter-Occupied | 1,485 | 10,772 | 20,730 | |
Owner-Occupied Values | < 100K | 54 | 302 | 646 |
100-199K | 231 | 1073 | 2490 | |
200-299K | 927 | 2538 | 4748 | |
300-399K | 646 | 4060 | 8646 | |
400-499K | 394 | 4379 | 8890 | |
500K+ | 1134 | 9748 | 21869 | |
Total Working Age Population | 8,507 | 60,792 | 129,611 | |
In Work Force | 4,509 | 37,472 | 81,215 | |
Not In Work Force | 3,998 | 23,320 | 48,396 | |
Workforce Employed | 4,328 | 35,838 | 78,166 | |
Workforce Unemployed | 181 | 1,602 | 2,975 | |
Civlian Workforce | 4,509 | 37,440 | 81,141 | |
Military Workforce | 0 | 32 | 74 | |
Total Households | 4,871 | 32,873 | 68,018 | |
Family Households | 2,304 | 18,144 | 40,068 | |
Non-Family Households | 2,567 | 14,729 | 27,951 | |
Married Couple | 1,802 | 14,864 | 33,128 | |
Other Family | 503 | 3,280 | 6,940 | |
Married w/Child | 530 | 4,531 | 10,791 | |
Single Male w/Child | 77 | 440 | 882 | |
Single Female w/Child | 175 | 1,200 | 2,414 |
Population Change Last Two Decades - Plus Projection
2000 | % | 2010 | % | 2020 | % | 2030 | |
---|---|---|---|---|---|---|---|
Arizona | 5,130,632 | +25 | 6,392,017 | +14 | 7,286,100 | +14 | 8,284,900 |
Maricopa County | 3,072,149 | +24 | 3,817,117 | +16 | 4,436,900 | +15 | 5,107,700 |
Total Working Age Population:
Total Households:
Total Working Age Population:
Total Households:
Total Working Age Population:
Total Households: