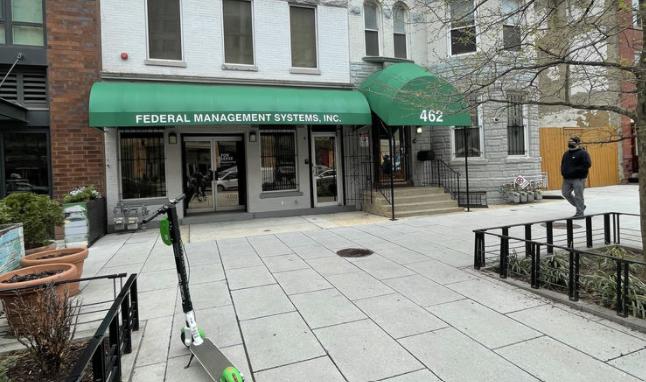
1-Mile | 3-Miles | 5-Miles | ||
---|---|---|---|---|
Total Population | 57,430 | 363,921 | 813,342 | |
Population Median Age | 36 | 36 | 37 | |
Population by Age | 0-9 Yrs | 3712 (6%) | 30757 (8%) | 89124 (10%) |
10-19 Yrs | 2126 (3%) | 26191 (7%) | 72583 (8%) | |
20-29 Yrs | 15751 (27%) | 89735 (24%) | 169095 (20%) | |
30-39 Yrs | 16784 (29%) | 88534 (24%) | 169365 (20%) | |
40-49 Yrs | 6785 (11%) | 41672 (11%) | 97369 (11%) | |
50-59 Yrs | 5239 (9%) | 34937 (9%) | 85781 (10%) | |
60-69 Yrs | 4020 (6%) | 27556 (7%) | 68488 (8%) | |
70+ Yrs | 3013 (5%) | 24539 (6%) | 61537 (7%) | |
Median HH Income | $111,032 | $103,789 | $91,156 | |
Total Household Income | < 24K | 4398 (14%) | 24315 (15%) | 57466 (16%) |
25-49K | 3003 (10%) | 17723 (10%) | 44467 (12%) | |
50-74K | 2830 (9%) | 18160 (11%) | 44631 (12%) | |
75-99K | 3113 (10%) | 17881 (11%) | 39078 (11%) | |
100-199K | 10185 (34%) | 50083 (31%) | 97389 (28%) | |
200K+ | 6111 (20%) | 33302 (20%) | 60611 (17%) | |
Highest Education Level | No Diploma | 3184 | 21253 | 53387 |
Diploma or GED | 4625 | 30337 | 91019 | |
Some College | 3315 | 23615 | 69533 | |
Assoc. Degree | 1130 | 6239 | 18180 | |
Bachelors Degree | 14754 | 82237 | 154924 | |
Higher Degree | 19819 | 110570 | 199399 | |
Total Housing Units | 32,961 | 179,990 | 379,586 | |
--Owner-Occupied | 8,136 | 61,820 | 134,073 | |
--Renter-Occupied | 21,504 | 99,644 | 209,568 | |
Owner-Occupied Values | < 100K | 164 | 855 | 2715 |
100-199K | 49 | 965 | 4191 | |
200-299K | 188 | 3236 | 13810 | |
300-399K | 502 | 7190 | 19026 | |
400-499K | 1413 | 7431 | 16971 | |
500K+ | 5821 | 42143 | 77360 | |
Total Working Age Population | 52,656 | 322,181 | 686,759 | |
In Work Force | 42,163 | 241,028 | 497,844 | |
Not In Work Force | 10,493 | 81,153 | 188,916 | |
Workforce Employed | 40,129 | 228,084 | 462,162 | |
Workforce Unemployed | 1,649 | 11,151 | 29,183 | |
Civlian Workforce | 41,779 | 239,235 | 491,345 | |
Military Workforce | 385 | 1,792 | 6,499 | |
Total Households | 29,640 | 161,464 | 343,641 | |
Family Households | 7,990 | 56,394 | 144,933 | |
Non-Family Households | 21,650 | 105,070 | 198,708 | |
Married Couple | 5,683 | 39,711 | 91,484 | |
Other Family | 2,307 | 16,683 | 53,449 | |
Married w/Child | 1,400 | 12,970 | 34,250 | |
Single Male w/Child | 154 | 1,527 | 4,702 | |
Single Female w/Child | 942 | 5,840 | 19,761 |
Population Change Last Two Decades - Plus Projection
2000 | % | 2010 | % | 2020 | % | 2030 | |
---|---|---|---|---|---|---|---|
District of Columbia | 572,059 | +5 | 601,723 | +21 | 729,501 | +15 | 842,154 |
Maryland | 5,296,486 | +9 | 5,773,552 | +6 | 6,141,900 | +6 | 6,518,750 |
Montgomery County | 873,341 | +11 | 971,777 | +8 | 1,052,050 | +7 | 1,128,800 |
Prince Georges County | 801,515 | +8 | 863,420 | +6 | 916,150 | +4 | 952,950 |
Virginia | 7,078,515 | +13 | 8,001,024 | +8 | 8,655,021 | +8 | 9,331,666 |
Arlington County | 189,453 | +10 | 207,627 | +20 | 249,298 | +10 | 274,339 |
Fairfax County | 969,749 | +12 | 1,081,726 | +7 | 1,162,504 | +7 | 1,244,025 |
Alexandria city | 128,283 | +9 | 139,966 | +19 | 166,261 | +10 | 182,067 |
Total Working Age Population:
Total Households:
Total Working Age Population:
Total Households:
Total Working Age Population:
Total Households: