Office Space
8686 East San Alberto Scottsdale, AZ 85258
8686 East San Alberto Scottsdale, AZ 85258

Details & Description
Property Highlights
• Amenity-Rich Central Scottsdale Location within McCormick Ranch
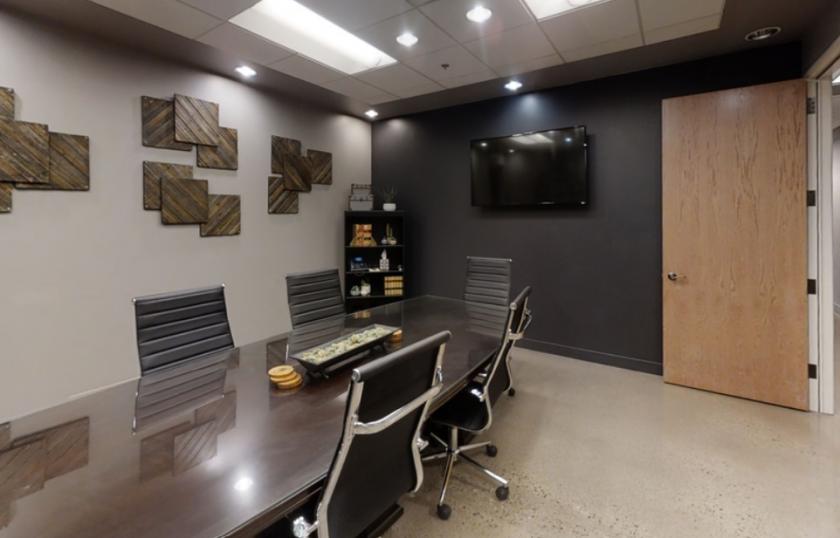
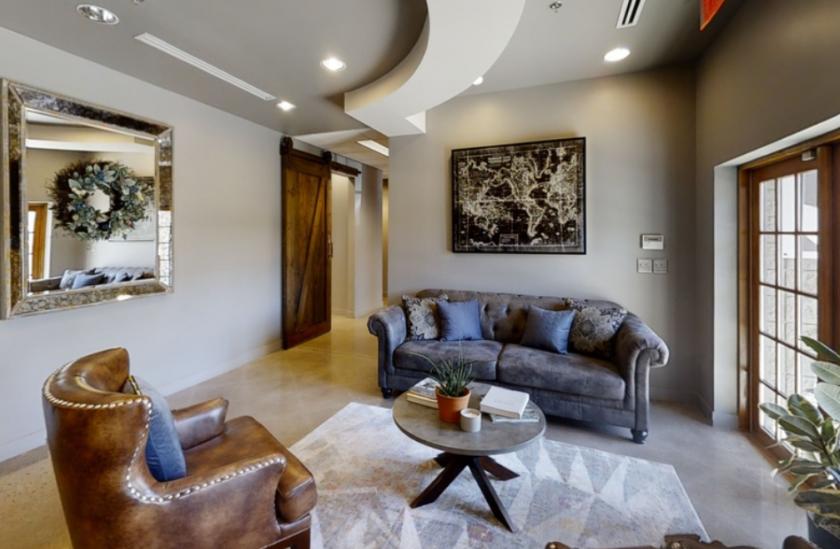
• Efficient Floor Plan Consisting of Tasteful Interior Finishes
Listing Agents

Zak Kottler
O: 480-294-6003
M: 480-272-1493
zkottler@levrose.com
O: 480-294-6003
M: 480-272-1493
zkottler@levrose.com
While we strive to provide the most accurate information, all listing information, and demographic data, is provided by third-parties. As such, MyEListing will not be responsible for the accuracy of the information. It is strongly recommended that you verify all information with the listing agent, and any relevant agencies, prior to making any decisions.