Industrial Properties
7155 Old Alexandria Ferry Road Clinton, MD 20735
7155 Old Alexandria Ferry Road Clinton, MD 20735

Details & Description
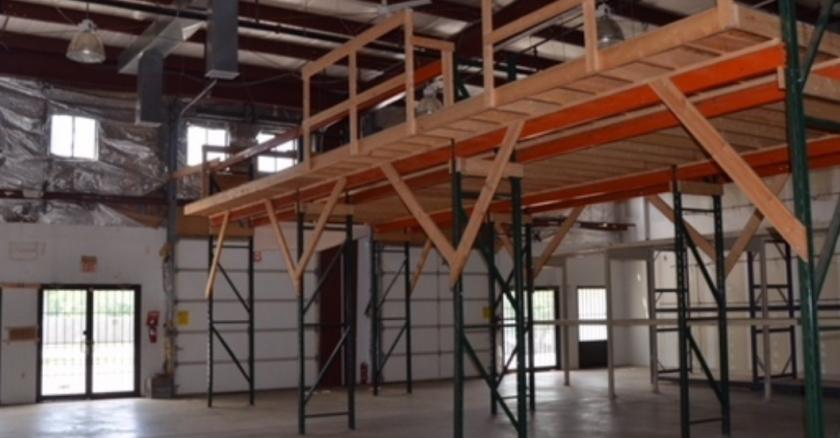
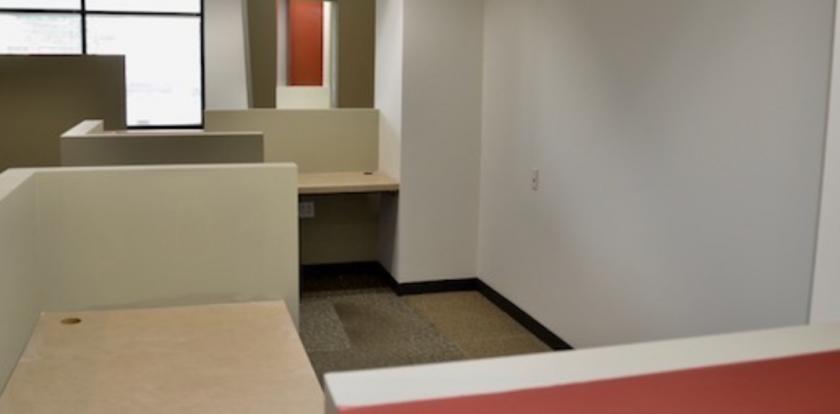
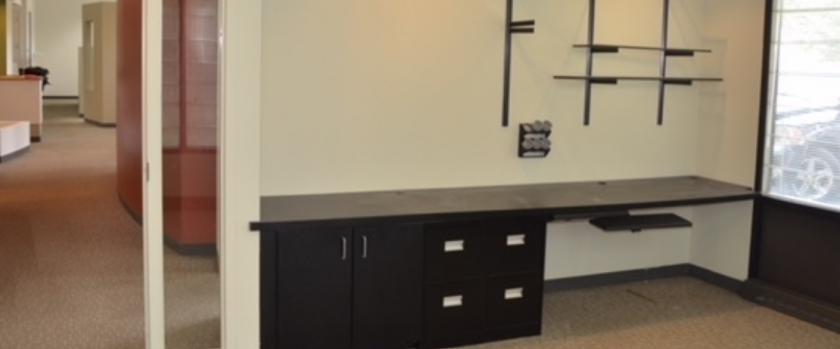
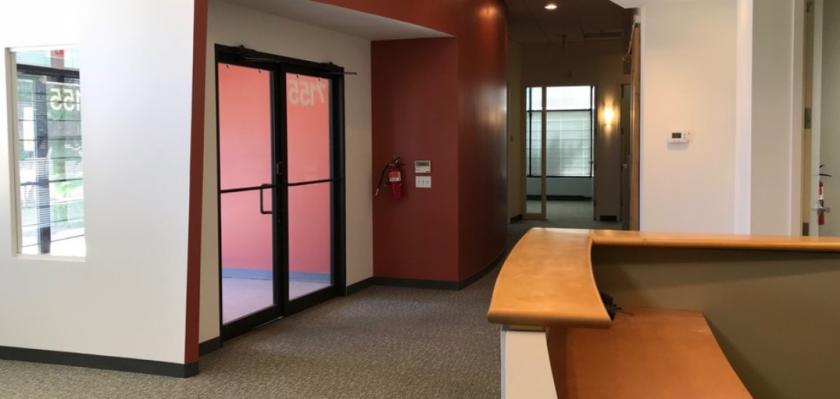
Additional Photos
Listing Agents

Erik Ulsaker
O: 703-506-2850
M: 703-861-0373
eu@lnf.com
O: 703-506-2850
M: 703-861-0373
eu@lnf.com

Matthew Garcia
O: 703-506-2850
mgarcia@lnf.com
O: 703-506-2850
mgarcia@lnf.com

Shadi Ayyoubi
O: 703-506-2850
shadi.ayyoubi@longandfoster.com
O: 703-506-2850
shadi.ayyoubi@longandfoster.com
While we strive to provide the most accurate information, all listing information, and demographic data, is provided by third-parties. As such, MyEListing will not be responsible for the accuracy of the information. It is strongly recommended that you verify all information with the listing agent, and any relevant agencies, prior to making any decisions.


