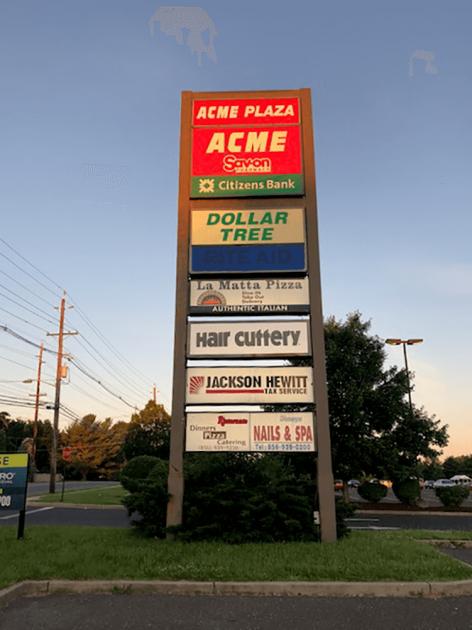
Retail Space
681 East Evesham Road Runnemede, NJ 08029
681 East Evesham Road Runnemede, NJ 08029
Details & Description
Property Highlights
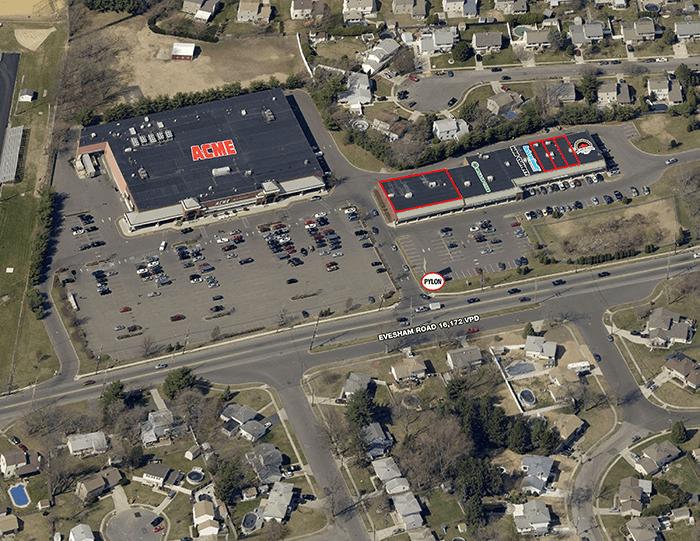
• Excellent opportunity for medical offices and restaurants full service or fast casual
• Over 270,000 people in a 5 mile radius with an average HH Income of $85,000
Listing Agents

Robert Cooper
O: 856-222-3054
M: 610-405-2600
rcooper@metrocommercial.com
O: 856-222-3054
M: 610-405-2600
rcooper@metrocommercial.com
While we strive to provide the most accurate information, all listing information, and demographic data, is provided by third-parties. As such, MyEListing will not be responsible for the accuracy of the information. It is strongly recommended that you verify all information with the listing agent, and any relevant agencies, prior to making any decisions.