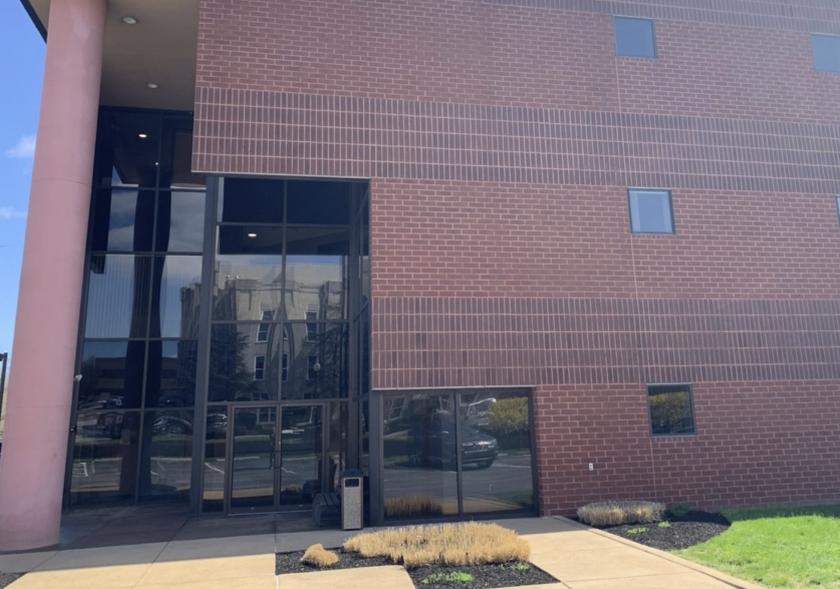
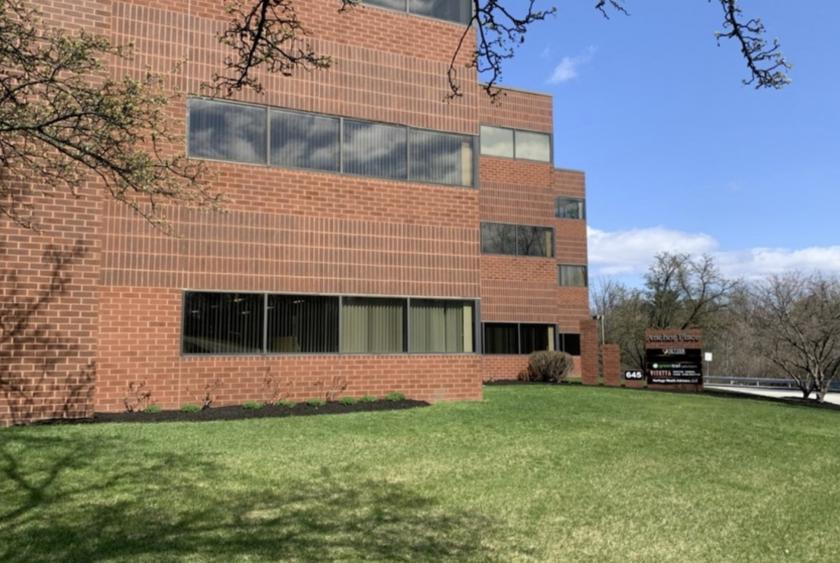
1-Mile | 3-Miles | 5-Miles | ||
---|---|---|---|---|
Total Population | 11,030 | 110,669 | 207,519 | |
Population Median Age | 41 | 39 | 39 | |
Population by Age | 0-9 Yrs | 1230 (11%) | 12670 (11%) | 24533 (11%) |
10-19 Yrs | 959 (8%) | 10617 (9%) | 23814 (11%) | |
20-29 Yrs | 1404 (12%) | 19047 (17%) | 31857 (15%) | |
30-39 Yrs | 2047 (18%) | 16385 (14%) | 28859 (13%) | |
40-49 Yrs | 1343 (12%) | 14757 (13%) | 27204 (13%) | |
50-59 Yrs | 1234 (11%) | 14623 (13%) | 27879 (13%) | |
60-69 Yrs | 1264 (11%) | 11898 (10%) | 22929 (11%) | |
70+ Yrs | 1550 (14%) | 10673 (9%) | 20444 (9%) | |
Median HH Income | $65,249 | $56,609 | $58,915 | |
Total Household Income | < 24K | 690 (13%) | 9522 (19%) | 15901 (18%) |
25-49K | 1225 (24%) | 12041 (24%) | 20789 (23%) | |
50-74K | 918 (18%) | 9102 (18%) | 17207 (19%) | |
75-99K | 881 (17%) | 6607 (13%) | 12269 (13%) | |
100-199K | 1161 (22%) | 9695 (19%) | 17672 (20%) | |
200K+ | 206 (4%) | 2246 (4%) | 4303 (4%) | |
Highest Education Level | No Diploma | 613 | 8539 | 15090 |
Diploma or GED | 2086 | 22453 | 43093 | |
Some College | 1480 | 13617 | 24643 | |
Assoc. Degree | 684 | 6150 | 11653 | |
Bachelors Degree | 2141 | 18047 | 32238 | |
Higher Degree | 1366 | 10821 | 19056 | |
Total Housing Units | 5,554 | 56,858 | 99,041 | |
--Owner-Occupied | 2,673 | 23,996 | 48,248 | |
--Renter-Occupied | 2,408 | 25,218 | 39,894 | |
Owner-Occupied Values | < 100K | 115 | 3710 | 8443 |
100-199K | 1536 | 12008 | 22126 | |
200-299K | 571 | 5431 | 11060 | |
300-399K | 243 | 1610 | 3811 | |
400-499K | 96 | 647 | 1537 | |
500K+ | 113 | 591 | 1271 | |
Total Working Age Population | 9,248 | 91,552 | 168,209 | |
In Work Force | 6,389 | 61,041 | 111,421 | |
Not In Work Force | 2,860 | 30,511 | 56,788 | |
Workforce Employed | 6,251 | 58,286 | 105,864 | |
Workforce Unemployed | 138 | 2,708 | 5,395 | |
Civlian Workforce | 6,389 | 60,994 | 111,259 | |
Military Workforce | 0 | 47 | 162 | |
Total Households | 5,081 | 49,214 | 88,142 | |
Family Households | 2,690 | 24,347 | 48,762 | |
Non-Family Households | 2,391 | 24,867 | 39,379 | |
Married Couple | 2,070 | 16,681 | 32,892 | |
Other Family | 620 | 7,667 | 15,870 | |
Married w/Child | 792 | 5,615 | 11,859 | |
Single Male w/Child | 154 | 934 | 2,114 | |
Single Female w/Child | 186 | 3,370 | 6,770 |
Population Change Last Two Decades - Plus Projection
2000 | % | 2010 | % | 2020 | % | 2030 | |
---|---|---|---|---|---|---|---|
Pennsylvania | 12,281,054 | +3 | 12,702,379 | +4 | 13,230,170 | +4 | 13,759,594 |
Cumberland County | 213,674 | +10 | 235,406 | +7 | 251,836 | +6 | 268,063 |
Dauphin County | 251,798 | +6 | 268,100 | +4 | 279,506 | +3 | 289,132 |
Juniata County | 22,821 | +8 | 24,636 | 0 | 24,681 | +1 | 25,013 |
Perry County | 43,602 | +5 | 45,969 | +6 | 48,597 | +4 | 50,348 |
York County | 381,751 | +14 | 434,972 | +6 | 460,514 | +5 | 484,497 |
Total Working Age Population:
Total Households:
Total Working Age Population:
Total Households:
Total Working Age Population:
Total Households: