Industrial Properties
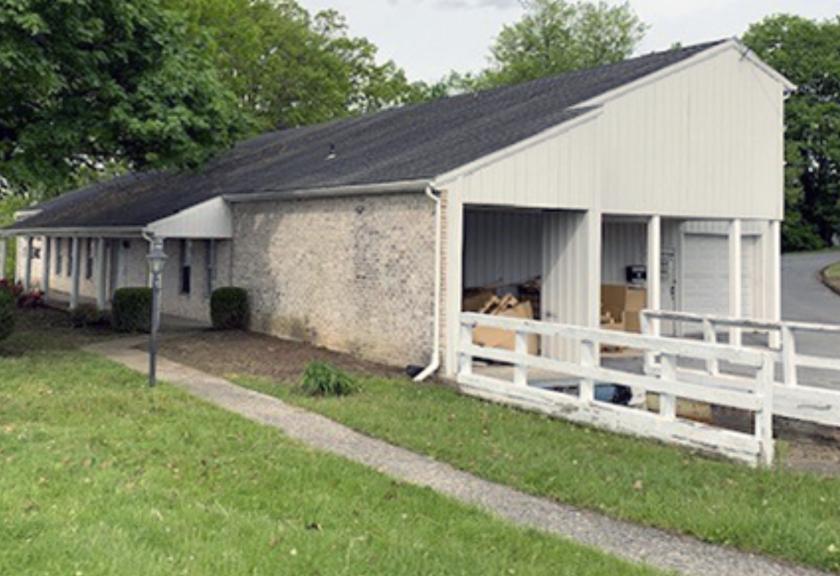
5535 Allentown Boulevard Harrisburg, PA 17112
5535 Allentown Boulevard Harrisburg, PA 17112

Details & Description
Listing Agents

Thomas Posavec
O: 717-731-1990
M: 717-503-7755
tposavec@landmarkcr.com
O: 717-731-1990
M: 717-503-7755
tposavec@landmarkcr.com
While we strive to provide the most accurate information, all listing information, and demographic data, is provided by third-parties. As such, MyEListing will not be responsible for the accuracy of the information. It is strongly recommended that you verify all information with the listing agent, and any relevant agencies, prior to making any decisions.