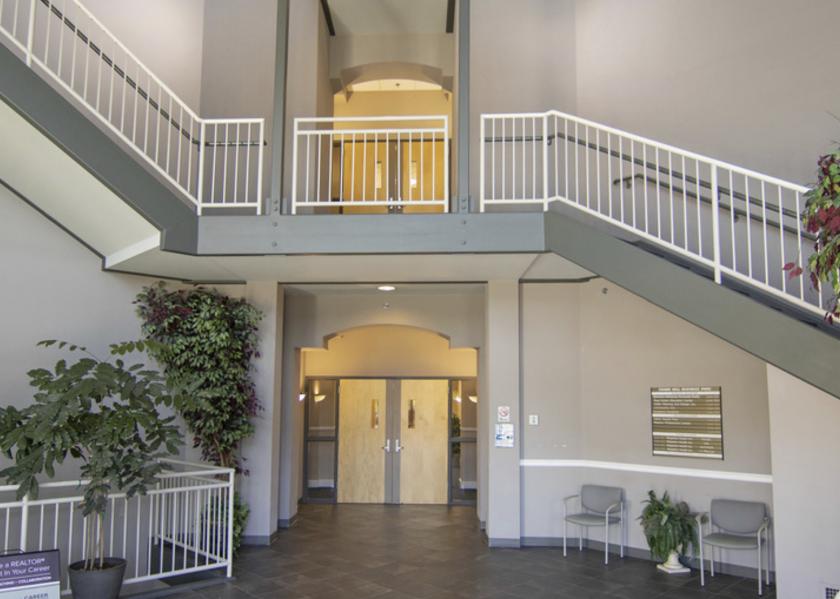
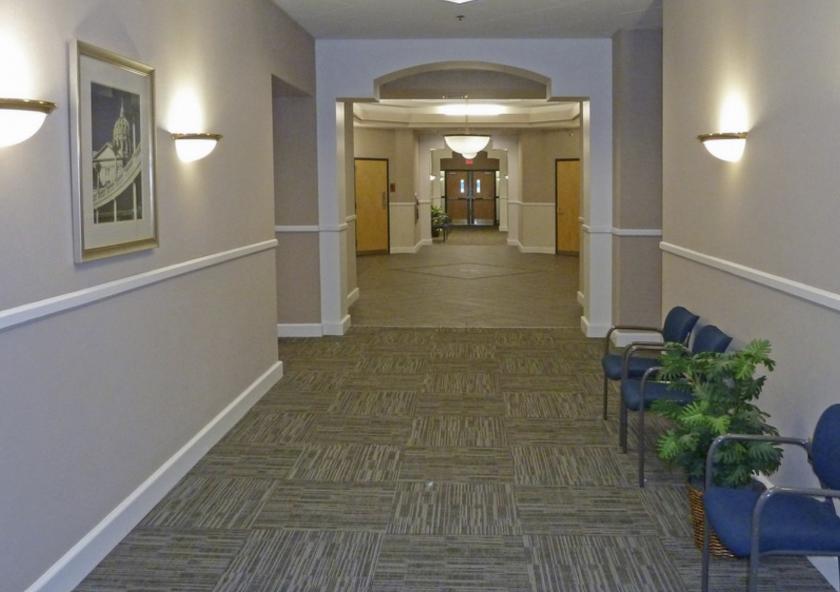
Office Space
4000 Crums Mill Road Harrisburg, PA 17112
4000 Crums Mill Road Harrisburg, PA 17112
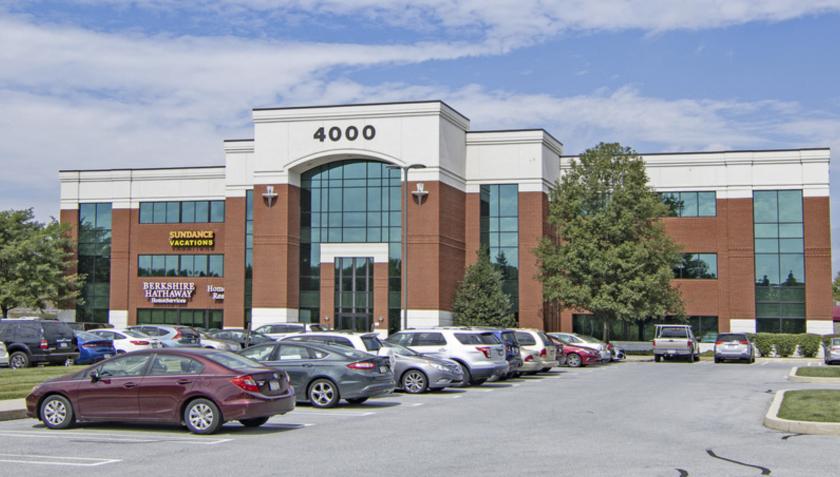
Details & Description
Property Highlights
• Various office suites available that can be customized to suit Tenants needs.
• Strong local ownership and management.
Listing Agents

Michael Curran
O: 717-731-1990
M: 717-805-9277
mcurran@landmarkcr.com
O: 717-731-1990
M: 717-805-9277
mcurran@landmarkcr.com
While we strive to provide the most accurate information, all listing information, and demographic data, is provided by third-parties. As such, MyEListing will not be responsible for the accuracy of the information. It is strongly recommended that you verify all information with the listing agent, and any relevant agencies, prior to making any decisions.