Industrial Properties
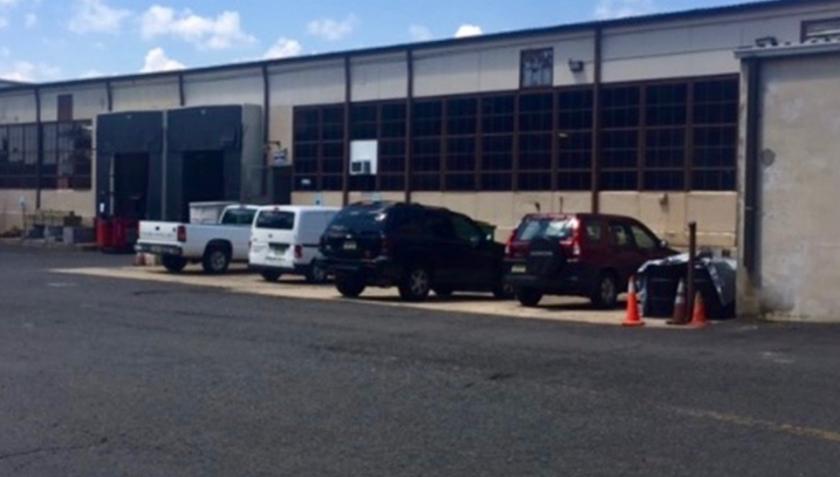
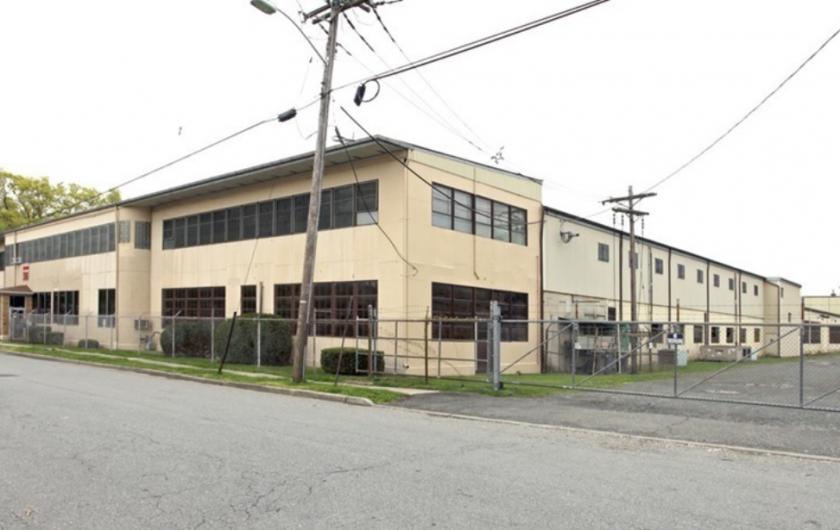
124 North 12th Street Kenilworth, NJ 07033
124 North 12th Street Kenilworth, NJ 07033
Details & Description
Listing Agents

Christian Walsifer
O: 973-973-6644
cwalsifer@blauberg.com
O: 973-973-6644
cwalsifer@blauberg.com

David Thomas
dathomas@blauberg.com
dathomas@blauberg.com
While we strive to provide the most accurate information, all listing information, and demographic data, is provided by third-parties. As such, MyEListing will not be responsible for the accuracy of the information. It is strongly recommended that you verify all information with the listing agent, and any relevant agencies, prior to making any decisions.