Industrial Properties
249 Thomas McGovern Drive Jersey City, NJ 07305
249 Thomas McGovern Drive Jersey City, NJ 07305
Details & Description
Property Highlights
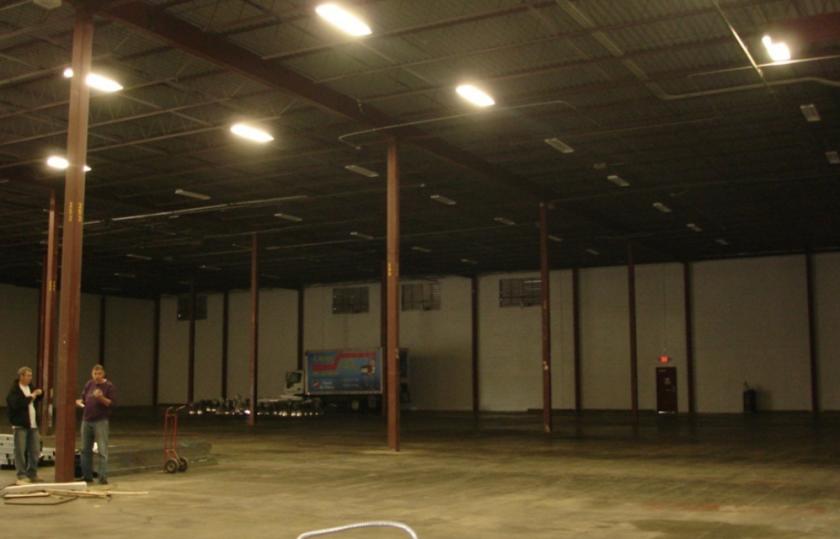
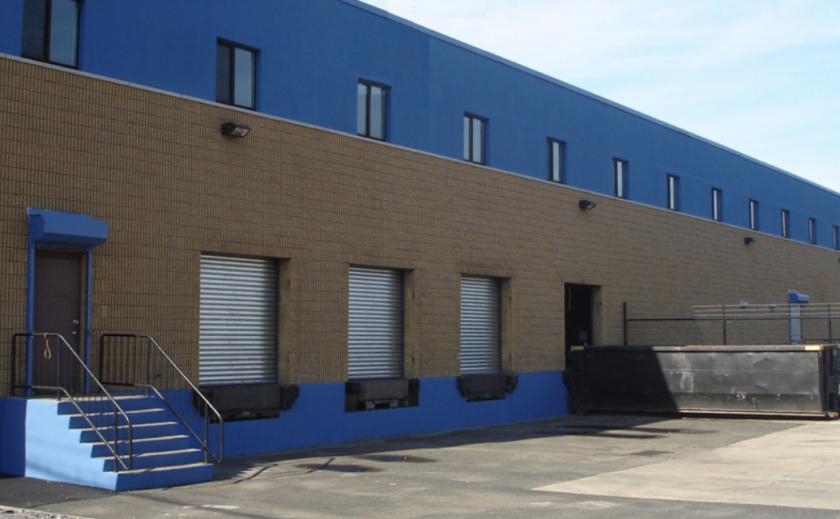
- • 5,500 to 17,500 SF Available Warehouse
- • 2.54 Acres Total Lot Size
- • Gas Suspended Heat
- • 24 Clear Ceiling Height
- • 40 x 40 Column Spacing
- • 5 Tailboards, 1 Drive-In
Listing Agents

Christian Walsifer
O: 973-973-6644
cwalsifer@blauberg.com
O: 973-973-6644
cwalsifer@blauberg.com

David Thomas
dathomas@blauberg.com
dathomas@blauberg.com
While we strive to provide the most accurate information, all listing information, and demographic data, is provided by third-parties. As such, MyEListing will not be responsible for the accuracy of the information. It is strongly recommended that you verify all information with the listing agent, and any relevant agencies, prior to making any decisions.