Industrial Properties
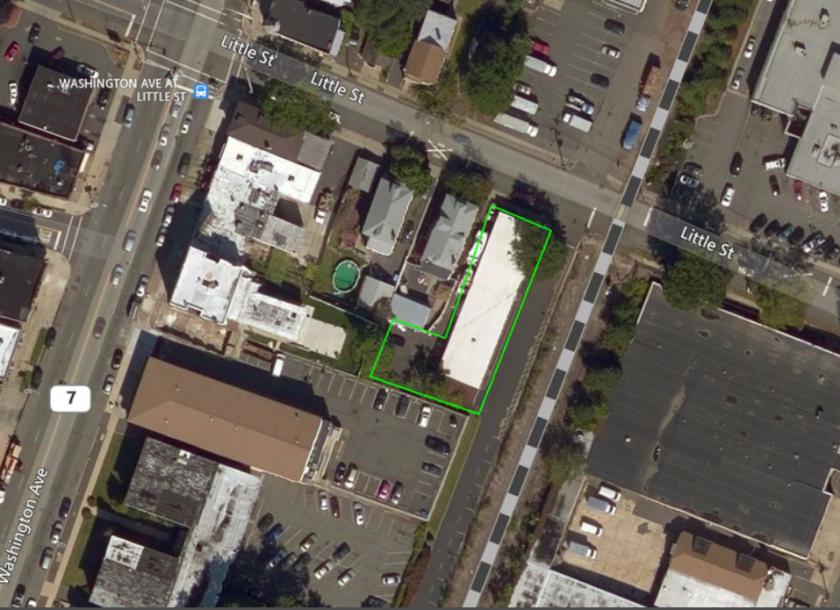
135 Little Street Belleville, NJ 07109
135 Little Street Belleville, NJ 07109

Details & Description
Property Highlights
- • Description 5,000 SF Free Standing One Story
- • Warehouse 4,600 SF Clear Span
- • Office 400 SF
- • Construction Brick and Steel
- • Ceiling Height 14 Clear
- • Loading Platform
Listing Agents

Anthony Bufanio
O: 973-379-6644
M: 973-568-6612
ambufanio@blauberg.com
O: 973-379-6644
M: 973-568-6612
ambufanio@blauberg.com
While we strive to provide the most accurate information, all listing information, and demographic data, is provided by third-parties. As such, MyEListing will not be responsible for the accuracy of the information. It is strongly recommended that you verify all information with the listing agent, and any relevant agencies, prior to making any decisions.