Retail Space
1490 East Broad Street Westfield, NJ 07090
1490 East Broad Street Westfield, NJ 07090
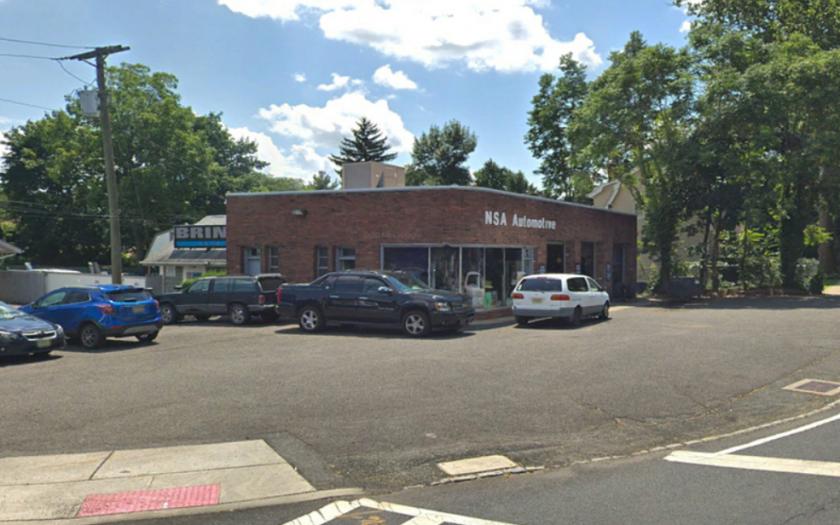
Details & Description
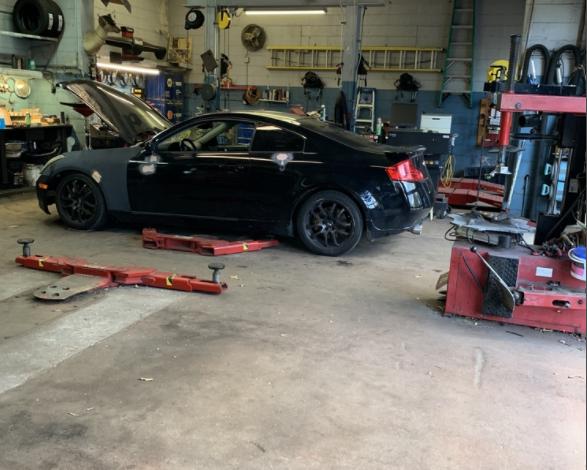
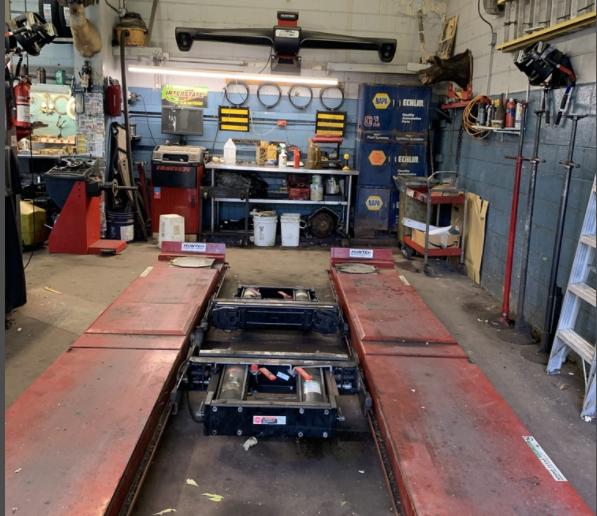
Property Highlights
- • 3 Bays, New Roof, HVAC and Repair Equipment
- • Used Car License Available
- • Great for OwnerOccupier or Car Dealer
Listing Agents

Frank Bruno
O: 973-379-6644
M: 718-887-1570
fbruno@blauberg.com
O: 973-379-6644
M: 718-887-1570
fbruno@blauberg.com
While we strive to provide the most accurate information, all listing information, and demographic data, is provided by third-parties. As such, MyEListing will not be responsible for the accuracy of the information. It is strongly recommended that you verify all information with the listing agent, and any relevant agencies, prior to making any decisions.