Office Space
2124 Oak Tree Road Edison, NJ 08820
2124 Oak Tree Road Edison, NJ 08820

Details & Description
Property Highlights
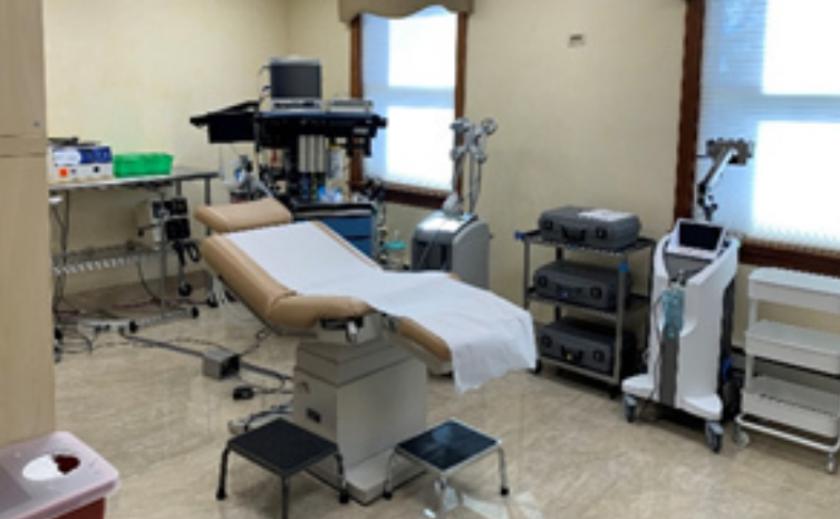
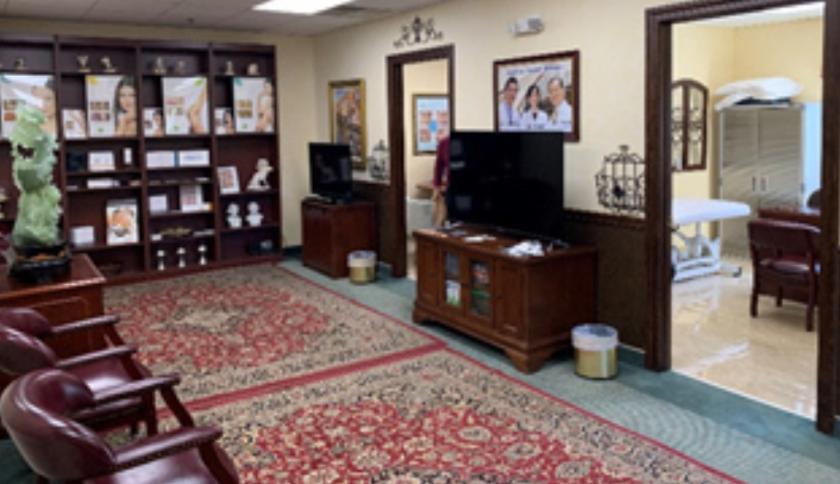
- • Currently Used As Medical Building
- • 3 Stories, Class B Office Fully Leased
- • Elevator Serviced, Wet Sprinkler System, HVAC
- • Ideal for Owner Occupied
- • Expanded Parking Possible
Listing Agents

Christopher Chiusolo
O: 973-379-6644
M: 973-970-0703
cchiusolo@blauberg.com
O: 973-379-6644
M: 973-970-0703
cchiusolo@blauberg.com
While we strive to provide the most accurate information, all listing information, and demographic data, is provided by third-parties. As such, MyEListing will not be responsible for the accuracy of the information. It is strongly recommended that you verify all information with the listing agent, and any relevant agencies, prior to making any decisions.