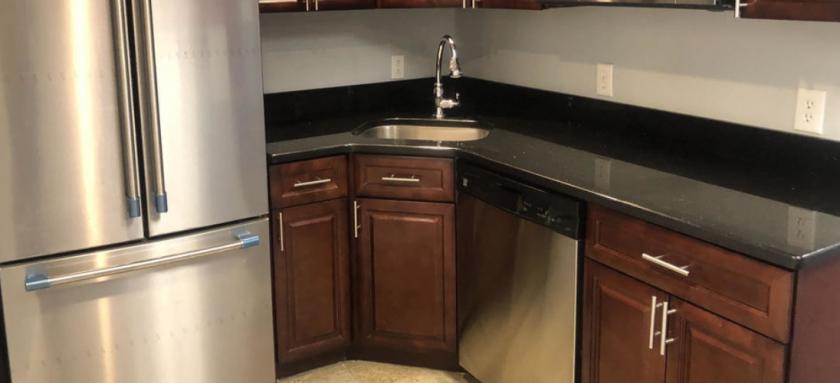
Office Space
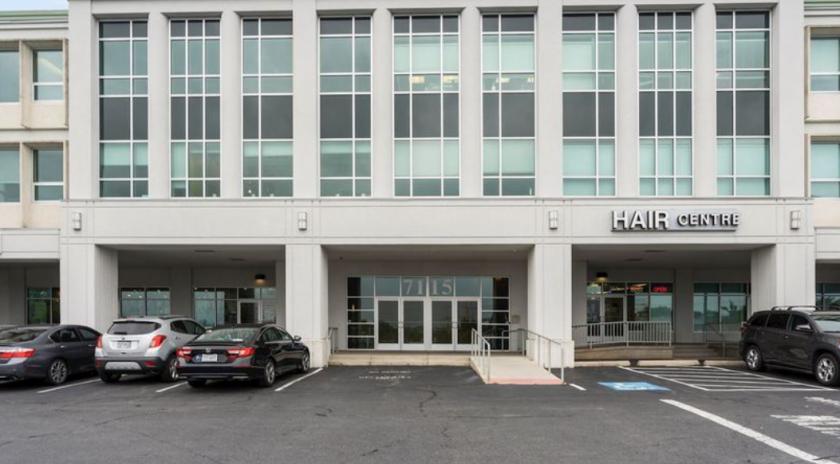
7115 Leesburg Pike Falls Church, VA 22043
7115 Leesburg Pike Falls Church, VA 22043
Details & Description
Property Highlights
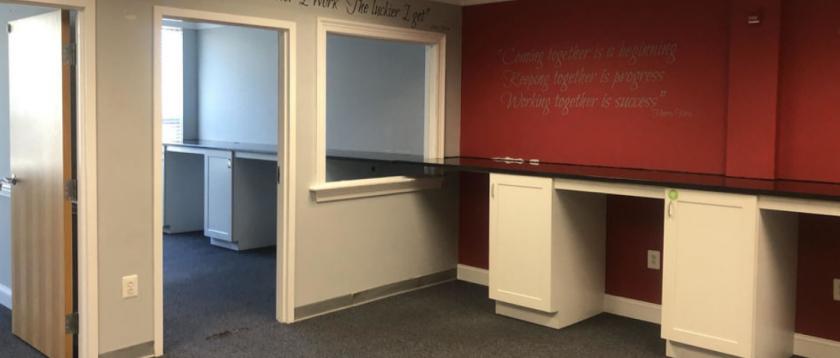
• Perfect for an owner-user as a turn key, no build-out required space
• Two 2 offices, large windows with a view of Greater Falls Church
Listing Agents

Erik Ulsaker
O: 703-506-2850
M: 703-861-0373
eu@lnf.com
O: 703-506-2850
M: 703-861-0373
eu@lnf.com
While we strive to provide the most accurate information, all listing information, and demographic data, is provided by third-parties. As such, MyEListing will not be responsible for the accuracy of the information. It is strongly recommended that you verify all information with the listing agent, and any relevant agencies, prior to making any decisions.