Office Space
3512 Trindle Road Camp Hill, PA 17011
3512 Trindle Road Camp Hill, PA 17011
Details & Description
Property Highlights
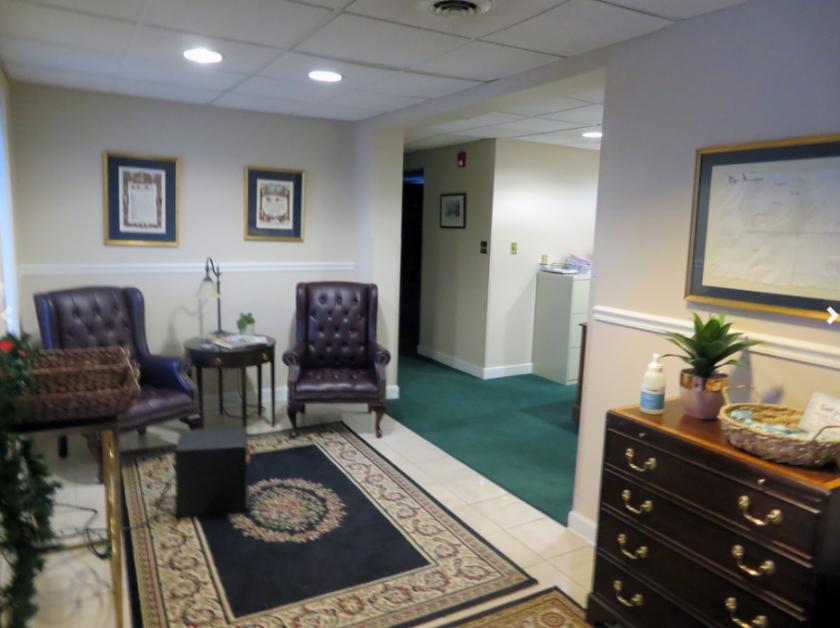
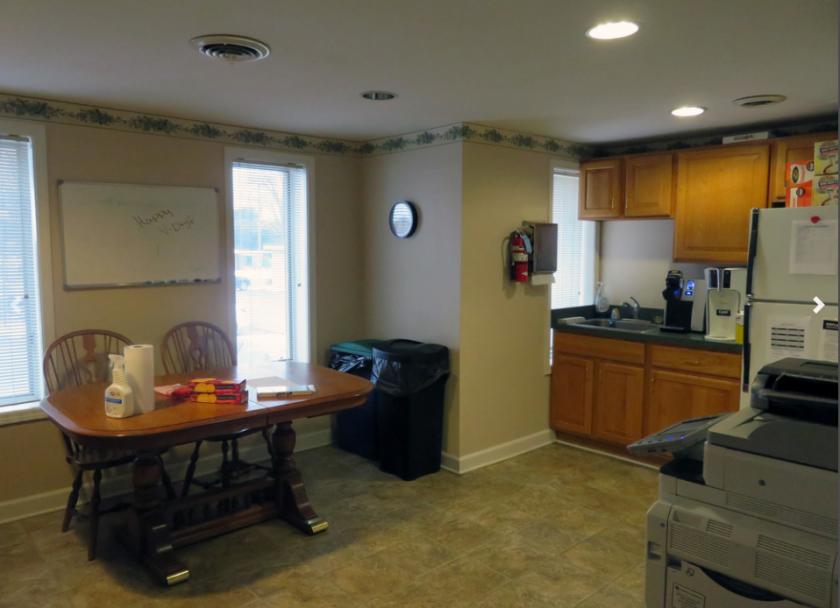
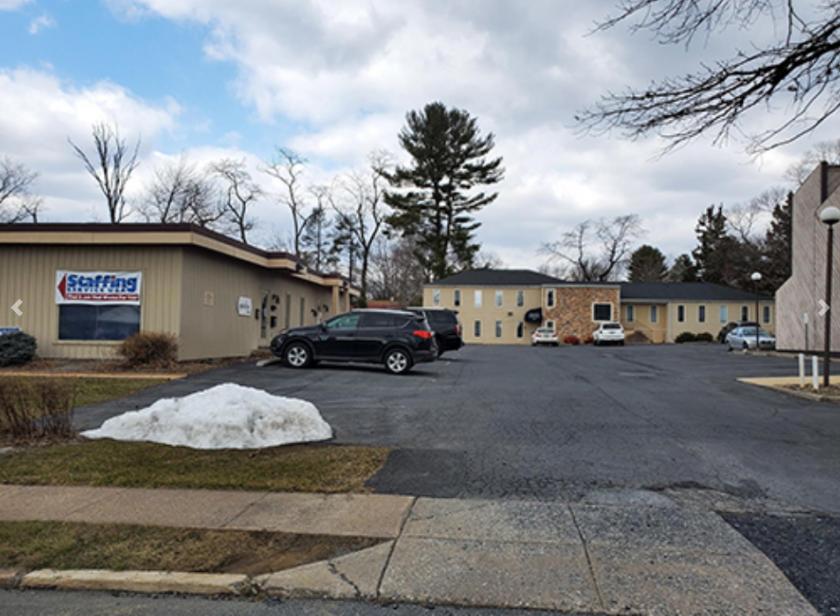
• One 2 story, 4,137 sq. ft. office building currently occupied by a law firm, will be vacating the building in May
• Second detached one story building, has a 1066 sq. ft. suite available for lease
Listing Agents

Bogumila Bo Mangam
O: 717-731-1990
M: 717-805-4166
bmangam@landmarkcr.com
O: 717-731-1990
M: 717-805-4166
bmangam@landmarkcr.com
While we strive to provide the most accurate information, all listing information, and demographic data, is provided by third-parties. As such, MyEListing will not be responsible for the accuracy of the information. It is strongly recommended that you verify all information with the listing agent, and any relevant agencies, prior to making any decisions.