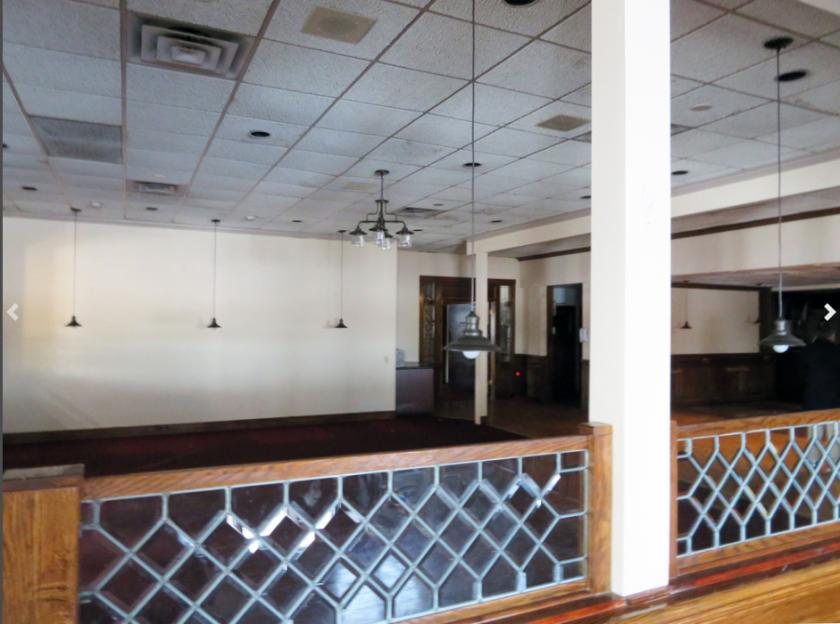
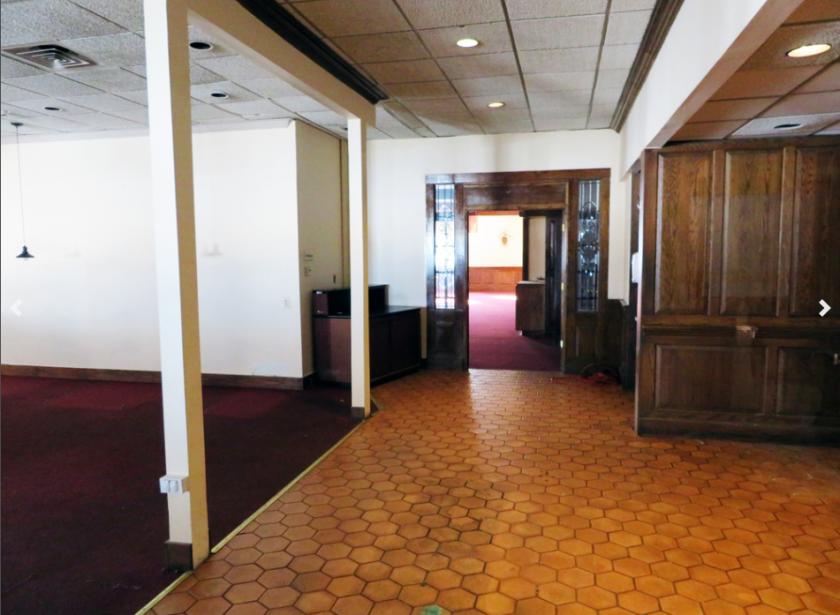
1-Mile | 3-Miles | 5-Miles | ||
---|---|---|---|---|
Total Population | 5,813 | 41,088 | 98,544 | |
Population Median Age | 42 | 41 | 40 | |
Population by Age | 0-9 Yrs | 559 (9%) | 4642 (11%) | 11624 (11%) |
10-19 Yrs | 756 (13%) | 4786 (11%) | 11251 (11%) | |
20-29 Yrs | 576 (9%) | 5186 (12%) | 12586 (12%) | |
30-39 Yrs | 798 (13%) | 5437 (13%) | 12845 (13%) | |
40-49 Yrs | 737 (12%) | 5342 (13%) | 12305 (12%) | |
50-59 Yrs | 840 (14%) | 5438 (13%) | 13281 (13%) | |
60-69 Yrs | 820 (14%) | 5554 (13%) | 13800 (14%) | |
70+ Yrs | 726 (12%) | 4703 (11%) | 10852 (11%) | |
Median HH Income | $74,822 | $74,374 | $69,871 | |
Total Household Income | < 24K | 271 (11%) | 2041 (12%) | 5849 (14%) |
25-49K | 416 (17%) | 3409 (20%) | 8318 (20%) | |
50-74K | 492 (20%) | 3086 (18%) | 7862 (19%) | |
75-99K | 256 (10%) | 2370 (13%) | 6248 (15%) | |
100-199K | 717 (30%) | 4784 (28%) | 10460 (25%) | |
200K+ | 201 (8%) | 1246 (7%) | 2408 (5%) | |
Highest Education Level | No Diploma | 298 | 1552 | 4459 |
Diploma or GED | 1595 | 8845 | 22304 | |
Some College | 745 | 5120 | 10925 | |
Assoc. Degree | 301 | 3038 | 6858 | |
Bachelors Degree | 780 | 6817 | 16095 | |
Higher Degree | 464 | 3995 | 9402 | |
Total Housing Units | 2,479 | 17,769 | 43,553 | |
--Owner-Occupied | 2,021 | 12,175 | 28,096 | |
--Renter-Occupied | 331 | 4,761 | 13,050 | |
Owner-Occupied Values | < 100K | 104 | 589 | 1894 |
100-199K | 1074 | 5581 | 14202 | |
200-299K | 633 | 3574 | 7066 | |
300-399K | 137 | 1546 | 3114 | |
400-499K | 51 | 412 | 797 | |
500K+ | 21 | 474 | 1024 | |
Total Working Age Population | 4,890 | 33,512 | 79,818 | |
In Work Force | 3,112 | 22,699 | 53,555 | |
Not In Work Force | 1,778 | 10,813 | 26,263 | |
Workforce Employed | 2,972 | 21,707 | 51,228 | |
Workforce Unemployed | 137 | 929 | 2,179 | |
Civlian Workforce | 3,109 | 22,636 | 53,407 | |
Military Workforce | 3 | 63 | 148 | |
Total Households | 2,352 | 16,936 | 41,146 | |
Family Households | 1,600 | 11,120 | 26,023 | |
Non-Family Households | 752 | 5,816 | 15,123 | |
Married Couple | 1,220 | 8,780 | 19,639 | |
Other Family | 381 | 2,340 | 6,384 | |
Married w/Child | 482 | 3,311 | 7,172 | |
Single Male w/Child | 34 | 325 | 847 | |
Single Female w/Child | 68 | 771 | 2,504 |
Population Change Last Two Decades - Plus Projection
2000 | % | 2010 | % | 2020 | % | 2030 | |
---|---|---|---|---|---|---|---|
Pennsylvania | 12,281,054 | +3 | 12,702,379 | +4 | 13,230,170 | +4 | 13,759,594 |
Cumberland County | 213,674 | +10 | 235,406 | +7 | 251,836 | +6 | 268,063 |
Dauphin County | 251,798 | +6 | 268,100 | +4 | 279,506 | +3 | 289,132 |
Lancaster County | 470,658 | +10 | 519,445 | +8 | 559,247 | +8 | 602,153 |
Total Working Age Population:
Total Households:
Total Working Age Population:
Total Households:
Total Working Age Population:
Total Households: