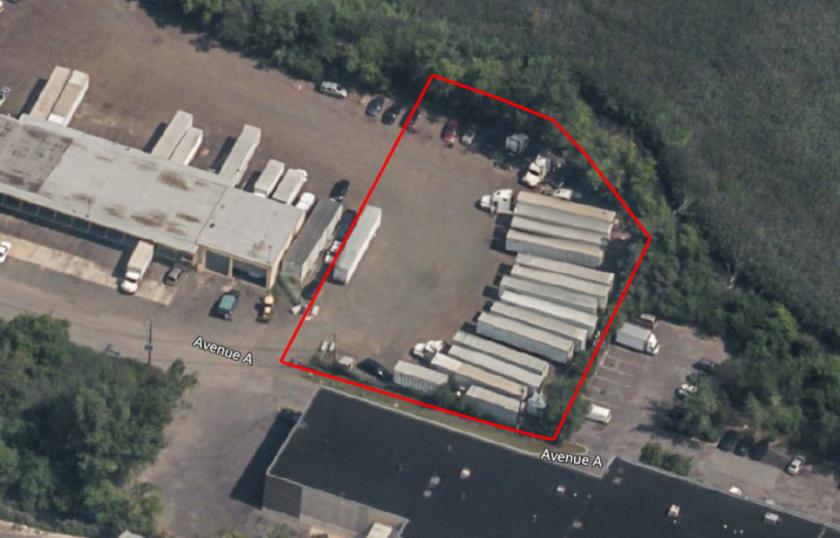
1-Mile | 3-Miles | 5-Miles | ||
---|---|---|---|---|
Total Population | 1,778 | 133,008 | 862,046 | |
Population Median Age | 42 | 40 | 39 | |
Population by Age | 0-9 Yrs | 243 (13%) | 13918 (10%) | 99982 (11%) |
10-19 Yrs | 154 (8%) | 14518 (10%) | 86286 (10%) | |
20-29 Yrs | 209 (11%) | 18627 (14%) | 122462 (14%) | |
30-39 Yrs | 221 (12%) | 19495 (14%) | 144293 (16%) | |
40-49 Yrs | 145 (8%) | 17648 (13%) | 116964 (13%) | |
50-59 Yrs | 322 (18%) | 18943 (14%) | 111621 (12%) | |
60-69 Yrs | 272 (15%) | 15335 (11%) | 89496 (10%) | |
70+ Yrs | 213 (11%) | 14524 (10%) | 90941 (10%) | |
Median HH Income | $84,666 | $76,878 | $81,052 | |
Total Household Income | < 24K | 77 (11%) | 7842 (16%) | 58790 (17%) |
25-49K | 120 (17%) | 8573 (17%) | 54758 (16%) | |
50-74K | 90 (13%) | 7562 (15%) | 47055 (13%) | |
75-99K | 126 (18%) | 5916 (12%) | 39272 (11%) | |
100-199K | 173 (25%) | 14147 (28%) | 85924 (25%) | |
200K+ | 85 (12%) | 4803 (9%) | 54423 (15%) | |
Highest Education Level | No Diploma | 137 | 13011 | 82169 |
Diploma or GED | 448 | 26126 | 145977 | |
Some College | 327 | 16020 | 78966 | |
Assoc. Degree | 72 | 6402 | 31256 | |
Bachelors Degree | 215 | 23238 | 163805 | |
Higher Degree | 117 | 10901 | 121317 | |
Total Housing Units | 704 | 51,771 | 371,375 | |
--Owner-Occupied | 476 | 23,935 | 134,865 | |
--Renter-Occupied | 196 | 24,908 | 205,358 | |
Owner-Occupied Values | < 100K | 22 | 689 | 3301 |
100-199K | 1 | 1158 | 8643 | |
200-299K | 70 | 3742 | 17918 | |
300-399K | 147 | 6432 | 29128 | |
400-499K | 153 | 5459 | 22455 | |
500K+ | 83 | 6455 | 53419 | |
Total Working Age Population | 1,448 | 110,696 | 711,829 | |
In Work Force | 1,023 | 74,068 | 480,057 | |
Not In Work Force | 425 | 36,627 | 231,772 | |
Workforce Employed | 1,007 | 70,615 | 458,448 | |
Workforce Unemployed | 16 | 3,437 | 21,343 | |
Civlian Workforce | 1,023 | 74,052 | 479,791 | |
Military Workforce | 0 | 16 | 265 | |
Total Households | 671 | 48,843 | 340,222 | |
Family Households | 456 | 34,141 | 210,222 | |
Non-Family Households | 216 | 14,702 | 130,000 | |
Married Couple | 328 | 24,552 | 150,148 | |
Other Family | 128 | 9,590 | 60,074 | |
Married w/Child | 121 | 10,622 | 64,199 | |
Single Male w/Child | 11 | 1,101 | 6,016 | |
Single Female w/Child | 18 | 2,394 | 18,761 |
Population Change Last Two Decades - Plus Projection
2000 | % | 2010 | % | 2020 | % | 2030 | |
---|---|---|---|---|---|---|---|
New Jersey | 8,414,350 | +4 | 8,791,894 | +4 | 9,132,700 | +4 | 9,530,900 |
Bergen County | 884,118 | +2 | 905,116 | +7 | 967,500 | +7 | 1,031,500 |
Essex County | 793,633 | -1 | 783,969 | +3 | 808,300 | +3 | 829,800 |
Hudson County | 608,975 | +4 | 634,266 | +12 | 708,100 | +6 | 747,400 |
Passaic County | 489,049 | +2 | 501,226 | +4 | 521,700 | +3 | 536,100 |
New York | 18,976,457 | +2 | 19,378,102 | +4 | 20,146,131 | +2 | 20,604,030 |
New York County | 1,537,195 | +3 | 1,585,873 | +6 | 1,688,894 | +2 | 1,727,631 |
Queens County | 2,229,379 | 0 | 2,230,722 | +9 | 2,436,549 | +5 | 2,565,268 |
Westchester County | 923,459 | +3 | 949,113 | +5 | 996,039 | +4 | 1,037,234 |
Total Working Age Population:
Total Households:
Total Working Age Population:
Total Households:
Total Working Age Population:
Total Households: