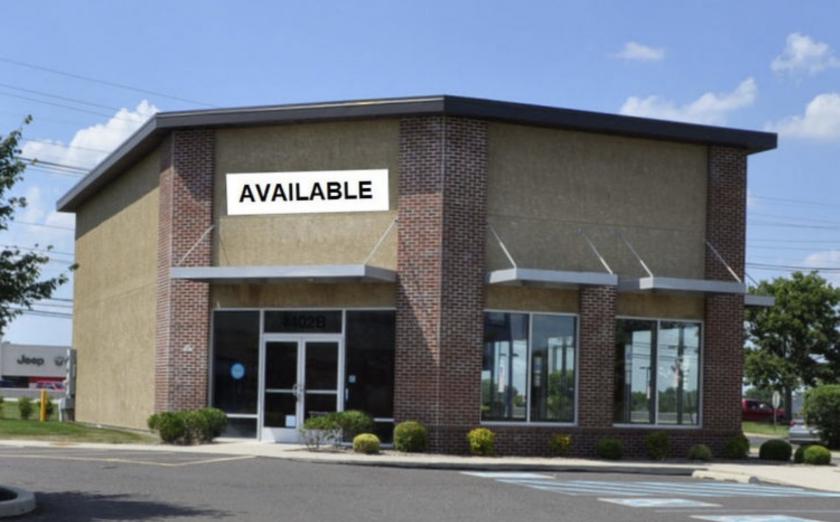
1-Mile | 3-Miles | 5-Miles | ||
---|---|---|---|---|
Total Population | 11,124 | 76,066 | 195,751 | |
Population Median Age | 40 | 40 | 40 | |
Population by Age | 0-9 Yrs | 1224 (11%) | 8402 (11%) | 21874 (11%) |
10-19 Yrs | 1163 (10%) | 9359 (12%) | 23375 (11%) | |
20-29 Yrs | 1660 (14%) | 9830 (12%) | 25717 (13%) | |
30-39 Yrs | 1433 (12%) | 8972 (11%) | 25129 (12%) | |
40-49 Yrs | 1673 (15%) | 10260 (13%) | 26484 (13%) | |
50-59 Yrs | 1600 (14%) | 11220 (14%) | 29068 (14%) | |
60-69 Yrs | 1260 (11%) | 9372 (12%) | 23139 (11%) | |
70+ Yrs | 1111 (9%) | 8651 (11%) | 20965 (10%) | |
Median HH Income | $77,324 | $70,158 | $71,023 | |
Total Household Income | < 24K | 494 (12%) | 4512 (16%) | 11102 (15%) |
25-49K | 666 (16%) | 5020 (17%) | 14038 (19%) | |
50-74K | 806 (19%) | 5530 (19%) | 13578 (18%) | |
75-99K | 827 (20%) | 4523 (16%) | 10530 (14%) | |
100-199K | 1098 (26%) | 7307 (25%) | 19039 (25%) | |
200K+ | 195 (4%) | 1297 (4%) | 5119 (6%) | |
Highest Education Level | No Diploma | 880 | 5098 | 12984 |
Diploma or GED | 3029 | 20117 | 48702 | |
Some College | 1729 | 11563 | 26822 | |
Assoc. Degree | 436 | 4145 | 11600 | |
Bachelors Degree | 1365 | 8315 | 24434 | |
Higher Degree | 455 | 4141 | 12857 | |
Total Housing Units | 4,488 | 31,404 | 79,766 | |
--Owner-Occupied | 2,532 | 19,905 | 50,513 | |
--Renter-Occupied | 1,555 | 8,285 | 22,893 | |
Owner-Occupied Values | < 100K | 181 | 1856 | 3435 |
100-199K | 1304 | 10494 | 20675 | |
200-299K | 758 | 5336 | 16246 | |
300-399K | 203 | 1454 | 6413 | |
400-499K | 11 | 414 | 1755 | |
500K+ | 74 | 351 | 1988 | |
Total Working Age Population | 9,257 | 62,255 | 159,979 | |
In Work Force | 6,814 | 41,628 | 108,861 | |
Not In Work Force | 2,443 | 20,627 | 51,117 | |
Workforce Employed | 6,191 | 37,788 | 100,873 | |
Workforce Unemployed | 565 | 3,672 | 7,583 | |
Civlian Workforce | 6,757 | 41,460 | 108,456 | |
Military Workforce | 57 | 168 | 406 | |
Total Households | 4,087 | 28,189 | 73,406 | |
Family Households | 2,959 | 19,223 | 49,482 | |
Non-Family Households | 1,127 | 8,966 | 23,923 | |
Married Couple | 1,938 | 12,299 | 33,992 | |
Other Family | 1,021 | 6,924 | 15,491 | |
Married w/Child | 631 | 3,893 | 12,454 | |
Single Male w/Child | 74 | 703 | 1,587 | |
Single Female w/Child | 461 | 2,474 | 5,249 |
Population Change Last Two Decades - Plus Projection
2000 | % | 2010 | % | 2020 | % | 2030 | |
---|---|---|---|---|---|---|---|
New Jersey | 8,414,350 | +4 | 8,791,894 | +4 | 9,132,700 | +4 | 9,530,900 |
Burlington County | 423,394 | +6 | 448,734 | 0 | 450,000 | +3 | 464,900 |
Camden County | 508,932 | +1 | 513,657 | 0 | 511,800 | +2 | 521,000 |
Pennsylvania | 12,281,054 | +3 | 12,702,379 | +4 | 13,230,170 | +4 | 13,759,594 |
Bucks County | 597,635 | +5 | 625,249 | +1 | 629,420 | +1 | 637,730 |
Philadelphia County | 1,517,550 | +1 | 1,526,006 | +8 | 1,653,729 | +6 | 1,753,054 |
Total Working Age Population:
Total Households:
Total Working Age Population:
Total Households:
Total Working Age Population:
Total Households: