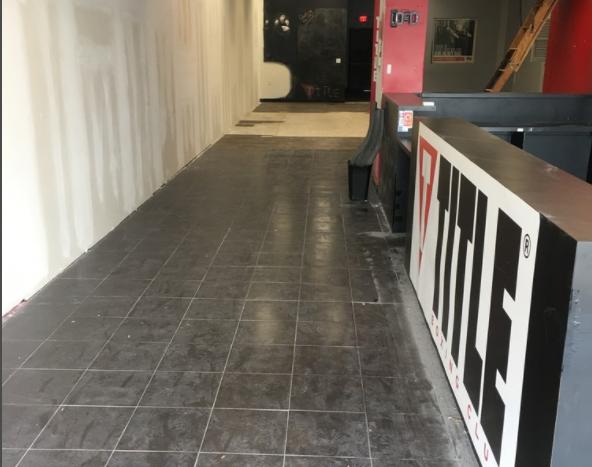
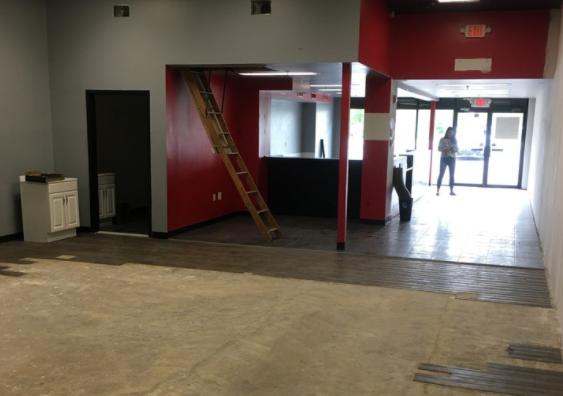
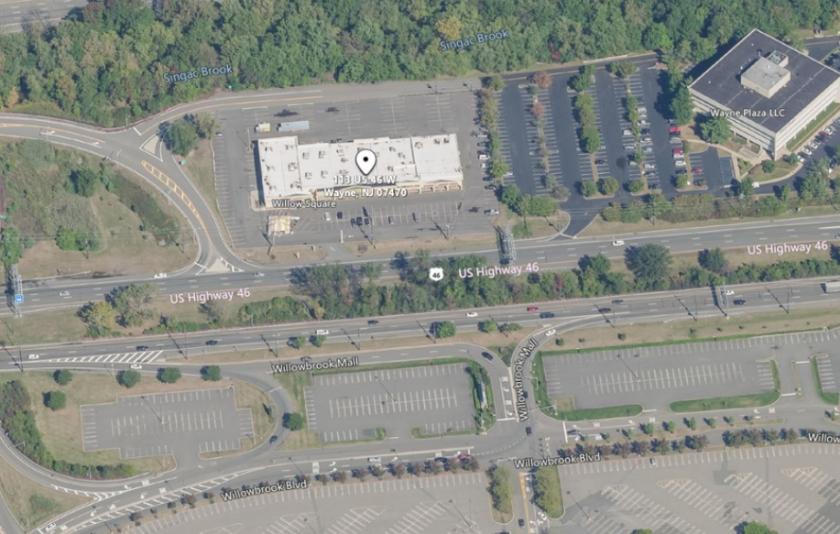
1-Mile | 3-Miles | 5-Miles | ||
---|---|---|---|---|
Total Population | 5,176 | 58,631 | 241,999 | |
Population Median Age | 40 | 43 | 40 | |
Population by Age | 0-9 Yrs | 722 (13%) | 6267 (10%) | 28447 (11%) |
10-19 Yrs | 590 (11%) | 6452 (11%) | 31430 (12%) | |
20-29 Yrs | 583 (11%) | 6088 (10%) | 28843 (11%) | |
30-39 Yrs | 614 (11%) | 6427 (10%) | 27319 (11%) | |
40-49 Yrs | 728 (14%) | 7569 (12%) | 32924 (13%) | |
50-59 Yrs | 714 (13%) | 9146 (15%) | 34697 (14%) | |
60-69 Yrs | 608 (11%) | 8195 (13%) | 28828 (11%) | |
70+ Yrs | 618 (11%) | 8487 (14%) | 29510 (12%) | |
Median HH Income | $90,849 | $111,809 | $101,064 | |
Total Household Income | < 24K | 231 (12%) | 1637 (7%) | 9754 (11%) |
25-49K | 235 (13%) | 2541 (12%) | 11158 (13%) | |
50-74K | 335 (18%) | 2616 (12%) | 10303 (12%) | |
75-99K | 163 (9%) | 2563 (12%) | 9755 (11%) | |
100-199K | 563 (31%) | 7444 (35%) | 25973 (31%) | |
200K+ | 281 (15%) | 4140 (19%) | 15722 (19%) | |
Highest Education Level | No Diploma | 409 | 2955 | 14922 |
Diploma or GED | 1111 | 11450 | 43998 | |
Some College | 539 | 6824 | 24937 | |
Assoc. Degree | 197 | 2551 | 8773 | |
Bachelors Degree | 959 | 12277 | 45963 | |
Higher Degree | 431 | 6832 | 28200 | |
Total Housing Units | 1,881 | 21,716 | 86,786 | |
--Owner-Occupied | 1,121 | 17,145 | 57,775 | |
--Renter-Occupied | 686 | 3,796 | 24,890 | |
Owner-Occupied Values | < 100K | 105 | 321 | 853 |
100-199K | 90 | 639 | 2783 | |
200-299K | 275 | 2453 | 7958 | |
300-399K | 272 | 4188 | 13064 | |
400-499K | 153 | 3464 | 12086 | |
500K+ | 226 | 6080 | 21030 | |
Total Working Age Population | 4,040 | 48,476 | 194,744 | |
In Work Force | 2,774 | 32,030 | 126,744 | |
Not In Work Force | 1,266 | 16,446 | 68,000 | |
Workforce Employed | 2,635 | 30,788 | 121,580 | |
Workforce Unemployed | 139 | 1,242 | 5,159 | |
Civlian Workforce | 2,774 | 32,030 | 126,740 | |
Military Workforce | 0 | 0 | 4 | |
Total Households | 1,807 | 20,941 | 82,665 | |
Family Households | 1,209 | 15,582 | 60,605 | |
Non-Family Households | 598 | 5,359 | 22,060 | |
Married Couple | 974 | 12,874 | 47,416 | |
Other Family | 235 | 2,708 | 13,189 | |
Married w/Child | 399 | 5,120 | 20,781 | |
Single Male w/Child | 30 | 264 | 1,353 | |
Single Female w/Child | 109 | 783 | 4,065 |
Population Change Last Two Decades - Plus Projection
2000 | % | 2010 | % | 2020 | % | 2030 | |
---|---|---|---|---|---|---|---|
New Jersey | 8,414,350 | +4 | 8,791,894 | +4 | 9,132,700 | +4 | 9,530,900 |
Bergen County | 884,118 | +2 | 905,116 | +7 | 967,500 | +7 | 1,031,500 |
Essex County | 793,633 | -1 | 783,969 | +3 | 808,300 | +3 | 829,800 |
Morris County | 470,212 | +5 | 492,276 | +3 | 509,100 | +5 | 535,600 |
Passaic County | 489,049 | +2 | 501,226 | +4 | 521,700 | +3 | 536,100 |
Total Working Age Population:
Total Households:
Total Working Age Population:
Total Households:
Total Working Age Population:
Total Households: