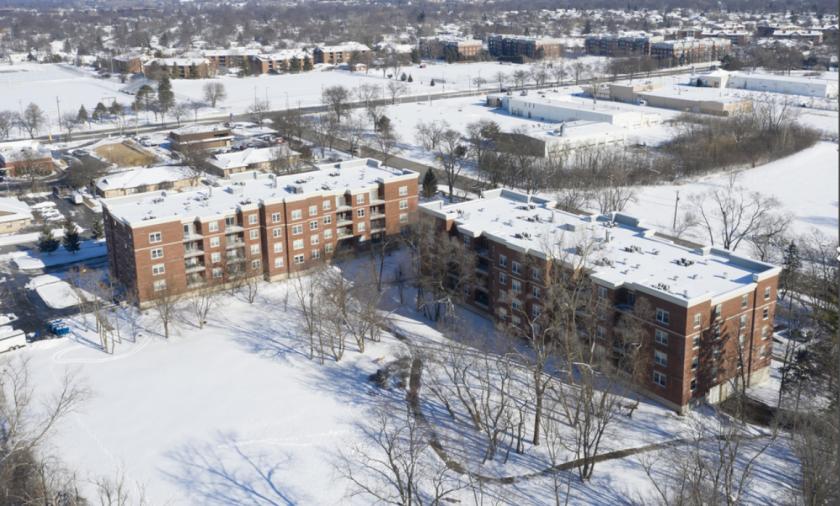
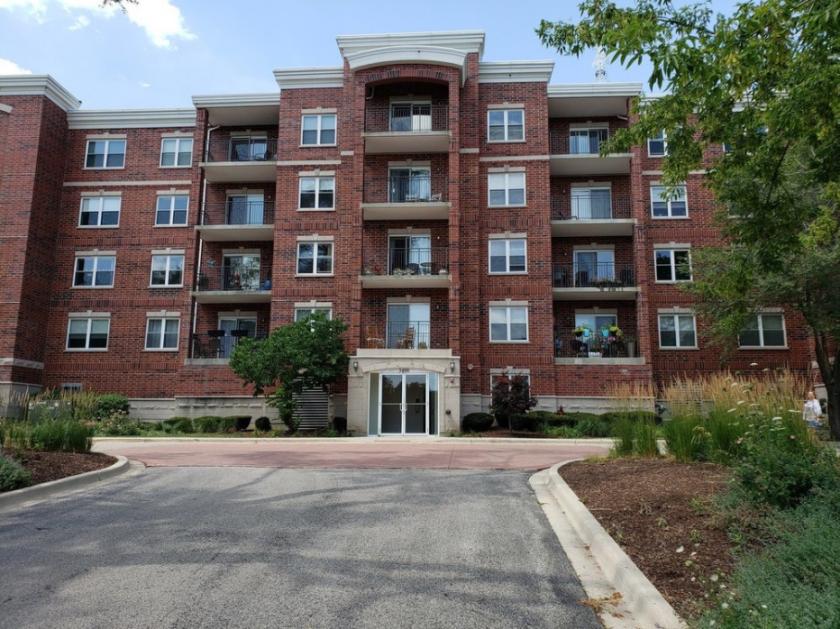
1-Mile | 3-Miles | 5-Miles | ||
---|---|---|---|---|
Total Population | 14,081 | 135,112 | 269,110 | |
Population Median Age | 41 | 40 | 40 | |
Population by Age | 0-9 Yrs | 1798 (12%) | 17336 (12%) | 33864 (12%) |
10-19 Yrs | 1558 (11%) | 16049 (11%) | 31736 (11%) | |
20-29 Yrs | 1178 (8%) | 14402 (10%) | 27690 (10%) | |
30-39 Yrs | 1683 (11%) | 19514 (14%) | 37847 (14%) | |
40-49 Yrs | 2171 (15%) | 19248 (14%) | 37304 (13%) | |
50-59 Yrs | 2202 (15%) | 18071 (13%) | 37815 (14%) | |
60-69 Yrs | 1937 (13%) | 16391 (12%) | 32988 (12%) | |
70+ Yrs | 1554 (11%) | 14101 (10%) | 29865 (11%) | |
Median HH Income | $98,403 | $87,145 | $90,687 | |
Total Household Income | < 24K | 555 (9%) | 5586 (10%) | 11401 (11%) |
25-49K | 777 (13%) | 8578 (16%) | 16439 (15%) | |
50-74K | 756 (13%) | 7783 (15%) | 15498 (14%) | |
75-99K | 742 (13%) | 7175 (14%) | 13402 (12%) | |
100-199K | 1968 (35%) | 15655 (30%) | 31357 (30%) | |
200K+ | 768 (13%) | 6089 (11%) | 15400 (14%) | |
Highest Education Level | No Diploma | 407 | 8229 | 14817 |
Diploma or GED | 1531 | 17230 | 32299 | |
Some College | 1824 | 16253 | 31728 | |
Assoc. Degree | 801 | 6454 | 12993 | |
Bachelors Degree | 3418 | 29699 | 60717 | |
Higher Degree | 2380 | 18153 | 39527 | |
Total Housing Units | 5,899 | 53,098 | 108,533 | |
--Owner-Occupied | 4,476 | 36,879 | 75,738 | |
--Renter-Occupied | 1,091 | 13,988 | 27,758 | |
Owner-Occupied Values | < 100K | 355 | 2644 | 4523 |
100-199K | 674 | 7854 | 13330 | |
200-299K | 1037 | 8842 | 18380 | |
300-399K | 1394 | 9049 | 17661 | |
400-499K | 686 | 4892 | 10015 | |
500K+ | 329 | 3599 | 11829 | |
Total Working Age Population | 11,191 | 107,169 | 214,597 | |
In Work Force | 7,767 | 76,214 | 150,417 | |
Not In Work Force | 3,424 | 30,955 | 64,180 | |
Workforce Employed | 7,475 | 73,595 | 144,987 | |
Workforce Unemployed | 291 | 2,620 | 5,369 | |
Civlian Workforce | 7,767 | 76,214 | 150,356 | |
Military Workforce | 0 | 0 | 61 | |
Total Households | 5,567 | 50,867 | 103,497 | |
Family Households | 3,871 | 35,495 | 70,645 | |
Non-Family Households | 1,696 | 15,372 | 32,851 | |
Married Couple | 3,386 | 29,284 | 58,876 | |
Other Family | 485 | 6,211 | 11,770 | |
Married w/Child | 1,254 | 12,356 | 24,831 | |
Single Male w/Child | 97 | 697 | 1,448 | |
Single Female w/Child | 137 | 2,328 | 4,068 |
Population Change Last Two Decades - Plus Projection
2000 | % | 2010 | % | 2020 | % | 2030 | |
---|---|---|---|---|---|---|---|
Illinois | 12,419,293 | +3 | 12,830,632 | +12 | 14,316,487 | +6 | 15,138,849 |
Cook County | 5,376,741 | -3 | 5,194,675 | +10 | 5,707,832 | +5 | 5,990,243 |
Lake County | 644,356 | +9 | 703,462 | +17 | 820,250 | +6 | 873,024 |
Total Working Age Population:
Total Households:
Total Working Age Population:
Total Households:
Total Working Age Population:
Total Households: