Industrial Properties
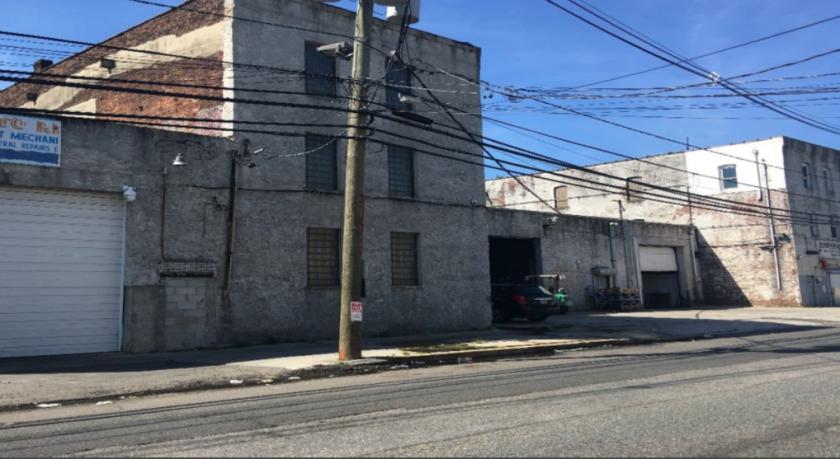
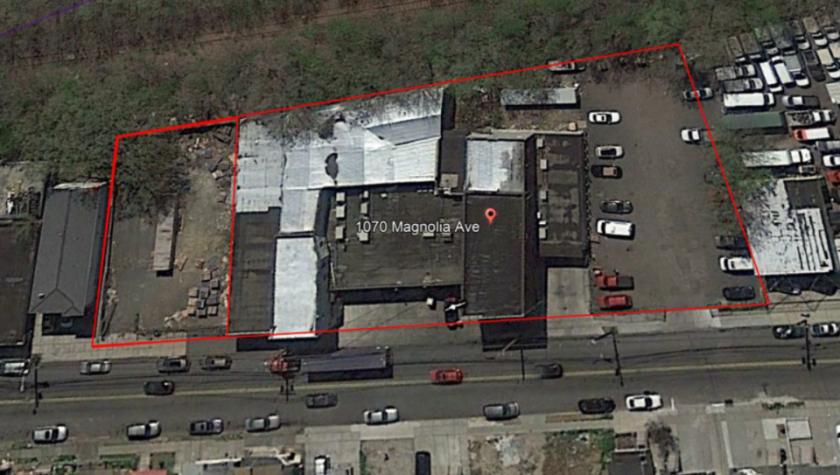
1070 Magnolia Avenue Elizabeth, NJ 07201
1070 Magnolia Avenue Elizabeth, NJ 07201
Details & Description
Property Highlights
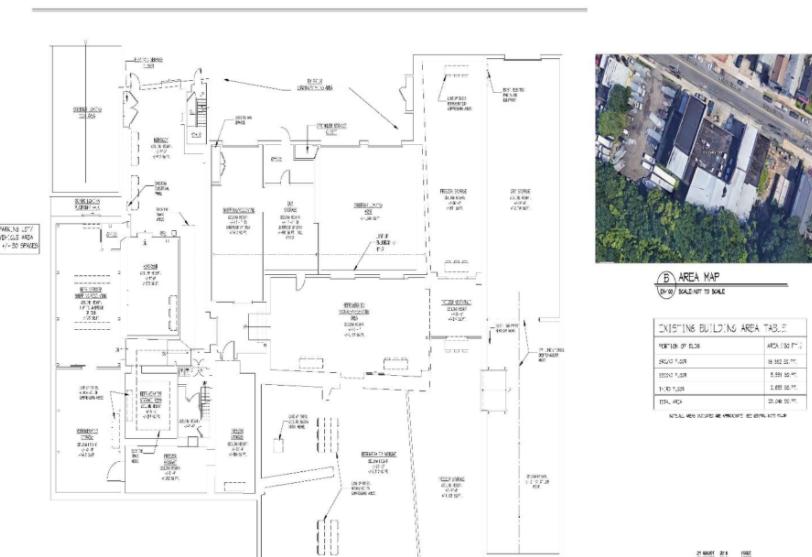
- • Future Expansion Approximately 17,000 SF
- • Heat Gas Suspended
- • Sprinkler System Wet System
- • Power 1600 Amp 208-240V, 3 Phase
- • Ceiling Heights 8- 26 Clear
- • Loading 3 Tailboards, 1 Drive-In
Listing Agents

Scott Savastano
O: 973-379-6644
M: 973-464-3800
sgsavastano@blauberg.com
O: 973-379-6644
M: 973-464-3800
sgsavastano@blauberg.com
While we strive to provide the most accurate information, all listing information, and demographic data, is provided by third-parties. As such, MyEListing will not be responsible for the accuracy of the information. It is strongly recommended that you verify all information with the listing agent, and any relevant agencies, prior to making any decisions.