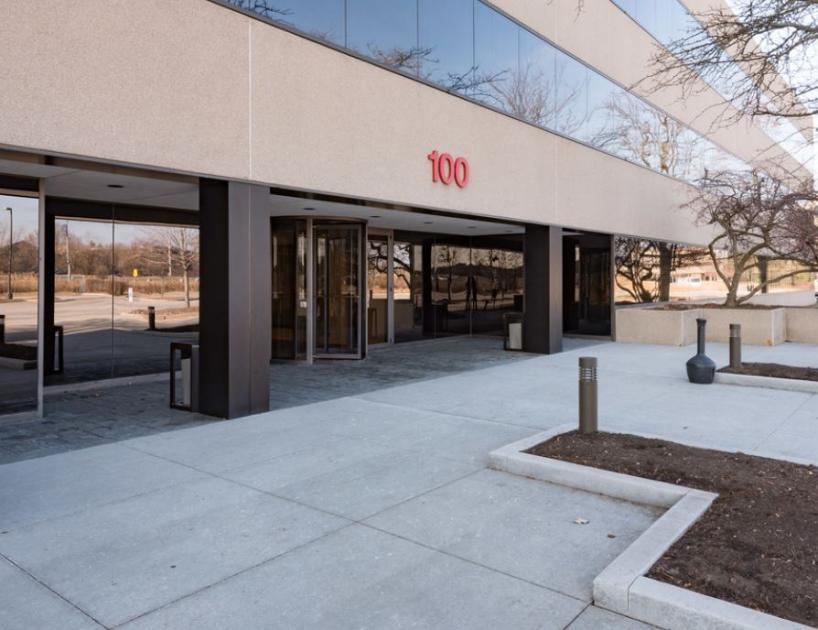
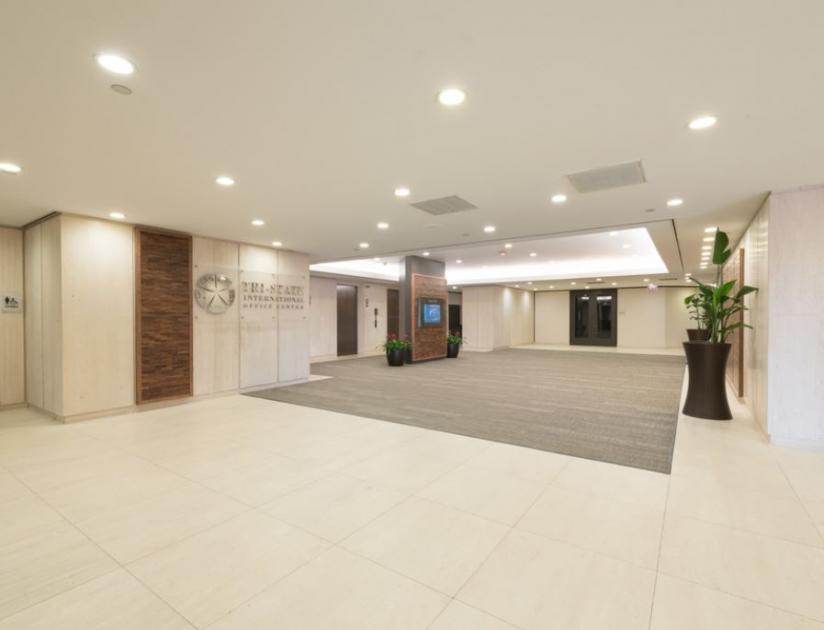
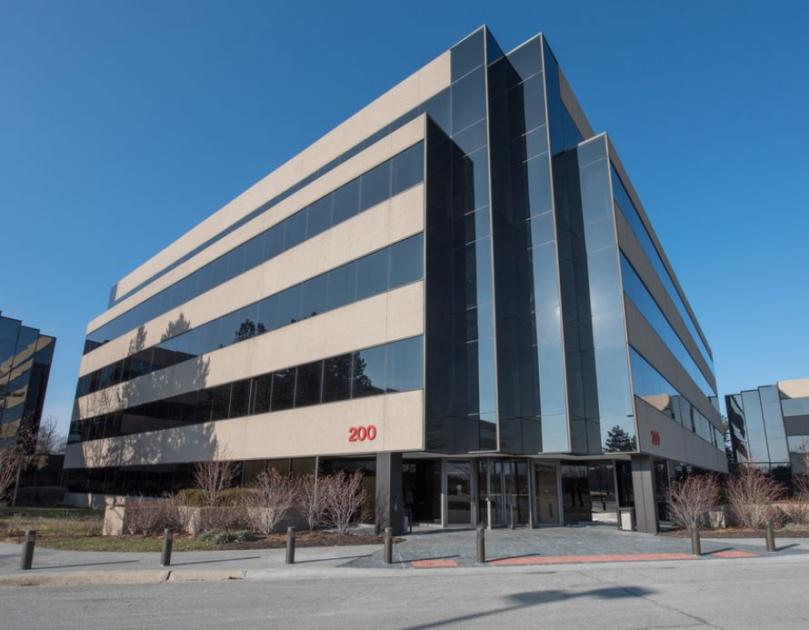
1-Mile | 3-Miles | 5-Miles | ||
---|---|---|---|---|
Total Population | 3,873 | 35,502 | 150,928 | |
Population Median Age | 40 | 42 | 41 | |
Population by Age | 0-9 Yrs | 428 (11%) | 4045 (11%) | 17229 (11%) |
10-19 Yrs | 640 (16%) | 5302 (14%) | 21267 (14%) | |
20-29 Yrs | 459 (11%) | 2924 (8%) | 13110 (8%) | |
30-39 Yrs | 301 (7%) | 3228 (9%) | 16945 (11%) | |
40-49 Yrs | 516 (13%) | 4909 (13%) | 20652 (13%) | |
50-59 Yrs | 509 (13%) | 5238 (14%) | 22592 (14%) | |
60-69 Yrs | 503 (12%) | 4623 (13%) | 18786 (12%) | |
70+ Yrs | 515 (13%) | 5233 (14%) | 20348 (13%) | |
Median HH Income | $186,330 | $158,331 | $118,423 | |
Total Household Income | < 24K | 77 (6%) | 903 (7%) | 5428 (9%) |
25-49K | 85 (6%) | 996 (7%) | 6628 (11%) | |
50-74K | 84 (6%) | 1042 (8%) | 6201 (11%) | |
75-99K | 72 (5%) | 1011 (8%) | 5755 (10%) | |
100-199K | 337 (27%) | 3757 (29%) | 16244 (28%) | |
200K+ | 567 (46%) | 4910 (38%) | 15805 (28%) | |
Highest Education Level | No Diploma | 32 | 417 | 4989 |
Diploma or GED | 193 | 1760 | 12830 | |
Some College | 246 | 2554 | 13362 | |
Assoc. Degree | 61 | 940 | 4486 | |
Bachelors Degree | 822 | 9051 | 36522 | |
Higher Degree | 1093 | 9448 | 32884 | |
Total Housing Units | 1,278 | 13,439 | 59,793 | |
--Owner-Occupied | 1,135 | 10,535 | 42,429 | |
--Renter-Occupied | 88 | 2,084 | 13,632 | |
Owner-Occupied Values | < 100K | 28 | 194 | 1437 |
100-199K | 8 | 200 | 3599 | |
200-299K | 42 | 551 | 5338 | |
300-399K | 88 | 1406 | 6904 | |
400-499K | 92 | 1355 | 6351 | |
500K+ | 876 | 6828 | 18800 | |
Total Working Age Population | 3,089 | 28,267 | 120,446 | |
In Work Force | 1,998 | 17,418 | 78,887 | |
Not In Work Force | 1,091 | 10,849 | 41,559 | |
Workforce Employed | 1,902 | 16,748 | 75,557 | |
Workforce Unemployed | 94 | 653 | 3,002 | |
Civlian Workforce | 1,996 | 17,401 | 78,559 | |
Military Workforce | 2 | 17 | 328 | |
Total Households | 1,223 | 12,619 | 56,061 | |
Family Households | 1,032 | 9,898 | 41,094 | |
Non-Family Households | 191 | 2,721 | 14,966 | |
Married Couple | 952 | 9,041 | 35,948 | |
Other Family | 80 | 856 | 5,146 | |
Married w/Child | 443 | 4,108 | 16,021 | |
Single Male w/Child | 5 | 91 | 636 | |
Single Female w/Child | 37 | 328 | 1,957 |
Population Change Last Two Decades - Plus Projection
2000 | % | 2010 | % | 2020 | % | 2030 | |
---|---|---|---|---|---|---|---|
Illinois | 12,419,293 | +3 | 12,830,632 | +12 | 14,316,487 | +6 | 15,138,849 |
Cook County | 5,376,741 | -3 | 5,194,675 | +10 | 5,707,832 | +5 | 5,990,243 |
Lake County | 644,356 | +9 | 703,462 | +17 | 820,250 | +6 | 873,024 |
Total Working Age Population:
Total Households:
Total Working Age Population:
Total Households:
Total Working Age Population:
Total Households: