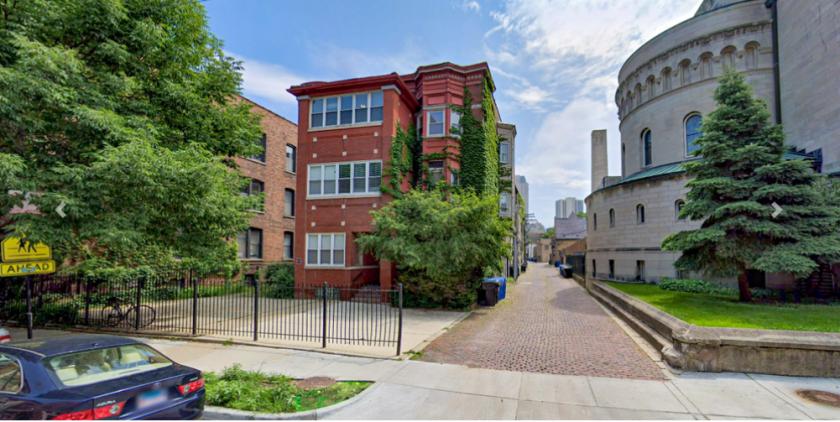
1-Mile | 3-Miles | 5-Miles | ||
---|---|---|---|---|
Total Population | 89,893 | 481,639 | 1,057,024 | |
Population Median Age | 35 | 36 | 37 | |
Population by Age | 0-9 Yrs | 6739 (7%) | 41372 (8%) | 100199 (9%) |
10-19 Yrs | 5608 (6%) | 24811 (5%) | 79747 (7%) | |
20-29 Yrs | 30529 (33%) | 129004 (26%) | 242663 (22%) | |
30-39 Yrs | 18584 (20%) | 118712 (24%) | 235152 (22%) | |
40-49 Yrs | 8281 (9%) | 53799 (11%) | 129210 (12%) | |
50-59 Yrs | 6782 (7%) | 43720 (9%) | 108366 (10%) | |
60-69 Yrs | 7334 (8%) | 37213 (7%) | 88577 (8%) | |
70+ Yrs | 6037 (6%) | 33010 (6%) | 73110 (6%) | |
Median HH Income | $96,393 | $100,217 | $84,591 | |
Total Household Income | < 24K | 6337 (13%) | 32628 (13%) | 81576 (16%) |
25-49K | 5343 (11%) | 27613 (11%) | 72583 (14%) | |
50-74K | 6621 (14%) | 32526 (13%) | 70231 (14%) | |
75-99K | 5705 (12%) | 30041 (12%) | 57999 (11%) | |
100-199K | 12506 (26%) | 70851 (28%) | 130225 (26%) | |
200K+ | 9853 (21%) | 52372 (21%) | 80676 (16%) | |
Highest Education Level | No Diploma | 1251 | 13881 | 67925 |
Diploma or GED | 3273 | 27986 | 96047 | |
Some College | 4965 | 33907 | 92025 | |
Assoc. Degree | 1525 | 12159 | 32907 | |
Bachelors Degree | 30929 | 164409 | 283700 | |
Higher Degree | 24339 | 123177 | 218418 | |
Total Housing Units | 50,233 | 275,480 | 554,078 | |
--Owner-Occupied | 18,147 | 102,136 | 200,407 | |
--Renter-Occupied | 28,218 | 143,894 | 292,884 | |
Owner-Occupied Values | < 100K | 280 | 1846 | 6712 |
100-199K | 1185 | 6775 | 22179 | |
200-299K | 2626 | 15503 | 38210 | |
300-399K | 2374 | 16686 | 35753 | |
400-499K | 2646 | 14762 | 26996 | |
500K+ | 9035 | 46565 | 70557 | |
Total Working Age Population | 80,392 | 425,031 | 913,358 | |
In Work Force | 63,387 | 337,276 | 682,125 | |
Not In Work Force | 17,005 | 87,756 | 231,233 | |
Workforce Employed | 61,478 | 327,365 | 653,370 | |
Workforce Unemployed | 1,909 | 9,796 | 28,375 | |
Civlian Workforce | 63,387 | 337,161 | 681,745 | |
Military Workforce | 0 | 115 | 380 | |
Total Households | 46,365 | 246,031 | 493,290 | |
Family Households | 14,386 | 88,460 | 205,027 | |
Non-Family Households | 31,978 | 157,570 | 288,263 | |
Married Couple | 12,458 | 73,351 | 154,290 | |
Other Family | 1,929 | 15,109 | 50,737 | |
Married w/Child | 4,906 | 26,596 | 56,248 | |
Single Male w/Child | 217 | 1,802 | 5,092 | |
Single Female w/Child | 508 | 4,774 | 16,672 |
Population Change Last Two Decades - Plus Projection
2000 | % | 2010 | % | 2020 | % | 2030 | |
---|---|---|---|---|---|---|---|
Illinois | 12,419,293 | +3 | 12,830,632 | +12 | 14,316,487 | +6 | 15,138,849 |
Cook County | 5,376,741 | -3 | 5,194,675 | +10 | 5,707,832 | +5 | 5,990,243 |
Total Working Age Population:
Total Households:
Total Working Age Population:
Total Households:
Total Working Age Population:
Total Households: