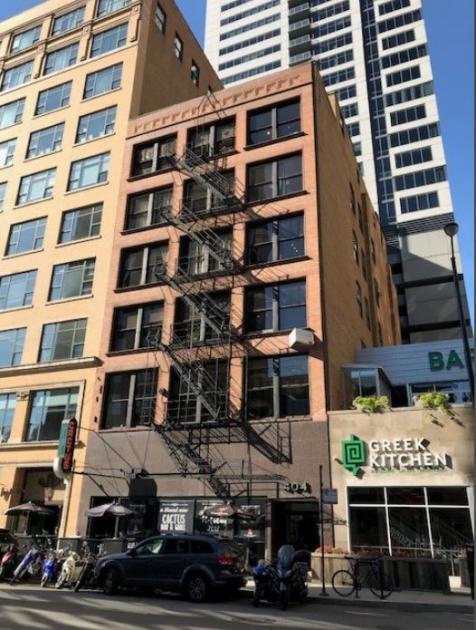
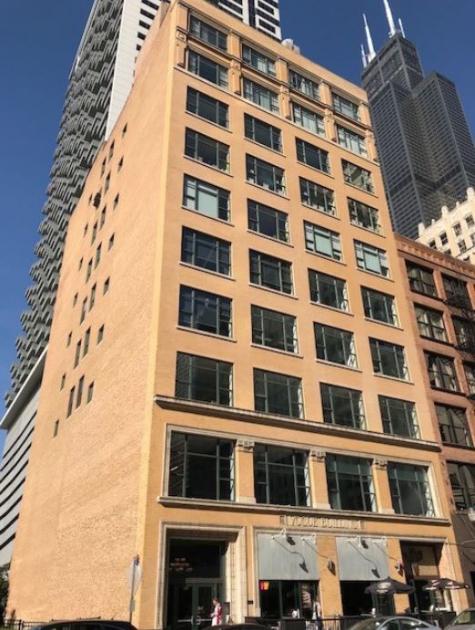
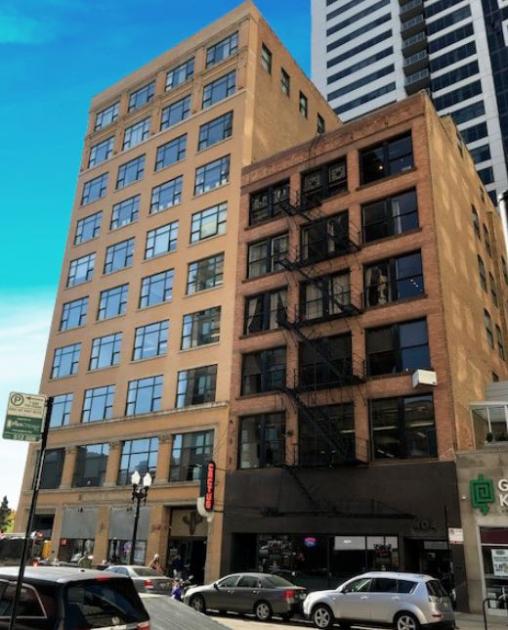
1-Mile | 3-Miles | 5-Miles | ||
---|---|---|---|---|
Total Population | 66,422 | 402,113 | 870,238 | |
Population Median Age | 34 | 38 | 36 | |
Population by Age | 0-9 Yrs | 3439 (5%) | 29530 (7%) | 85354 (9%) |
10-19 Yrs | 5647 (8%) | 26630 (6%) | 74959 (8%) | |
20-29 Yrs | 19580 (29%) | 98152 (24%) | 204842 (23%) | |
30-39 Yrs | 18502 (27%) | 93339 (23%) | 183187 (21%) | |
40-49 Yrs | 7545 (11%) | 44981 (11%) | 100713 (11%) | |
50-59 Yrs | 5726 (8%) | 41681 (10%) | 87703 (10%) | |
60-69 Yrs | 3775 (5%) | 38750 (9%) | 74805 (8%) | |
70+ Yrs | 2206 (3%) | 29050 (7%) | 58674 (6%) | |
Median HH Income | $116,636 | $99,218 | $81,554 | |
Total Household Income | < 24K | 3918 (11%) | 33435 (16%) | 79082 (19%) |
25-49K | 2736 (7%) | 21983 (10%) | 55349 (13%) | |
50-74K | 3603 (10%) | 24924 (12%) | 52446 (13%) | |
75-99K | 4670 (13%) | 23427 (11%) | 44532 (11%) | |
100-199K | 12477 (35%) | 59796 (29%) | 99725 (25%) | |
200K+ | 7939 (22%) | 42511 (20%) | 65974 (16%) | |
Highest Education Level | No Diploma | 1061 | 21000 | 68845 |
Diploma or GED | 2085 | 28019 | 86709 | |
Some College | 3341 | 32590 | 76740 | |
Assoc. Degree | 1678 | 9849 | 24837 | |
Bachelors Degree | 21206 | 115661 | 208606 | |
Higher Degree | 21109 | 107087 | 170331 | |
Total Housing Units | 41,176 | 236,009 | 451,639 | |
--Owner-Occupied | 13,157 | 83,380 | 153,519 | |
--Renter-Occupied | 22,185 | 122,697 | 243,588 | |
Owner-Occupied Values | < 100K | 189 | 1844 | 5552 |
100-199K | 415 | 4728 | 16900 | |
200-299K | 2744 | 14295 | 28086 | |
300-399K | 3665 | 15750 | 26179 | |
400-499K | 2510 | 12985 | 21770 | |
500K+ | 3634 | 33778 | 55033 | |
Total Working Age Population | 62,102 | 360,161 | 742,864 | |
In Work Force | 47,664 | 266,089 | 531,287 | |
Not In Work Force | 14,438 | 94,072 | 211,577 | |
Workforce Employed | 45,602 | 255,308 | 502,431 | |
Workforce Unemployed | 1,879 | 10,550 | 28,540 | |
Civlian Workforce | 47,481 | 265,858 | 530,971 | |
Military Workforce | 184 | 231 | 316 | |
Total Households | 35,343 | 206,076 | 397,107 | |
Family Households | 11,885 | 79,644 | 169,053 | |
Non-Family Households | 23,457 | 126,433 | 228,054 | |
Married Couple | 10,373 | 62,520 | 116,060 | |
Other Family | 1,512 | 17,124 | 52,993 | |
Married w/Child | 2,416 | 17,606 | 40,703 | |
Single Male w/Child | 89 | 1,447 | 4,596 | |
Single Female w/Child | 500 | 5,581 | 20,271 |
Population Change Last Two Decades - Plus Projection
2000 | % | 2010 | % | 2020 | % | 2030 | |
---|---|---|---|---|---|---|---|
Illinois | 12,419,293 | +3 | 12,830,632 | +12 | 14,316,487 | +6 | 15,138,849 |
Cook County | 5,376,741 | -3 | 5,194,675 | +10 | 5,707,832 | +5 | 5,990,243 |
Total Working Age Population:
Total Households:
Total Working Age Population:
Total Households:
Total Working Age Population:
Total Households: