Industrial Properties
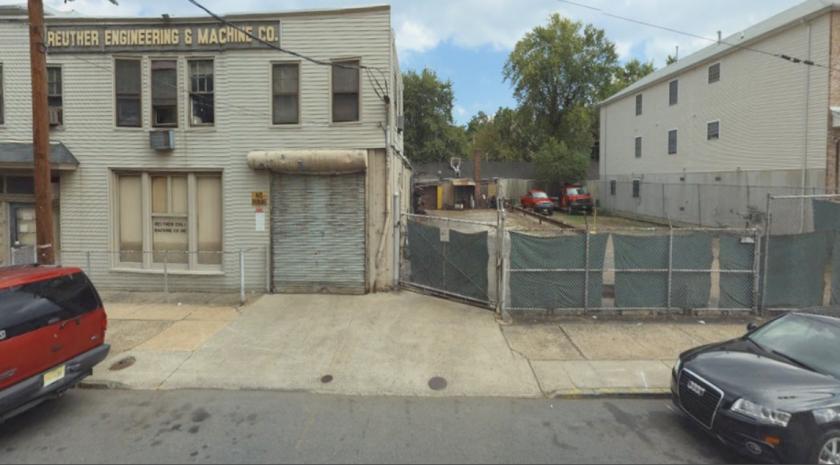
134 South 14th Street Newark, NJ 07107
134 South 14th Street Newark, NJ 07107
Details & Description
Property Highlights
- • 10,510 SF
- • Gas Suspended Heat
- • Column Spacing Varies
- • 8-10 Ceiling Heights
- • 1 Drive-In
Listing Agents

Jason M. Crimmins
O: 973-379-6644
M: 973-568-6611
jmcrimmins@blauberg.com
O: 973-379-6644
M: 973-568-6611
jmcrimmins@blauberg.com
While we strive to provide the most accurate information, all listing information, and demographic data, is provided by third-parties. As such, MyEListing will not be responsible for the accuracy of the information. It is strongly recommended that you verify all information with the listing agent, and any relevant agencies, prior to making any decisions.


