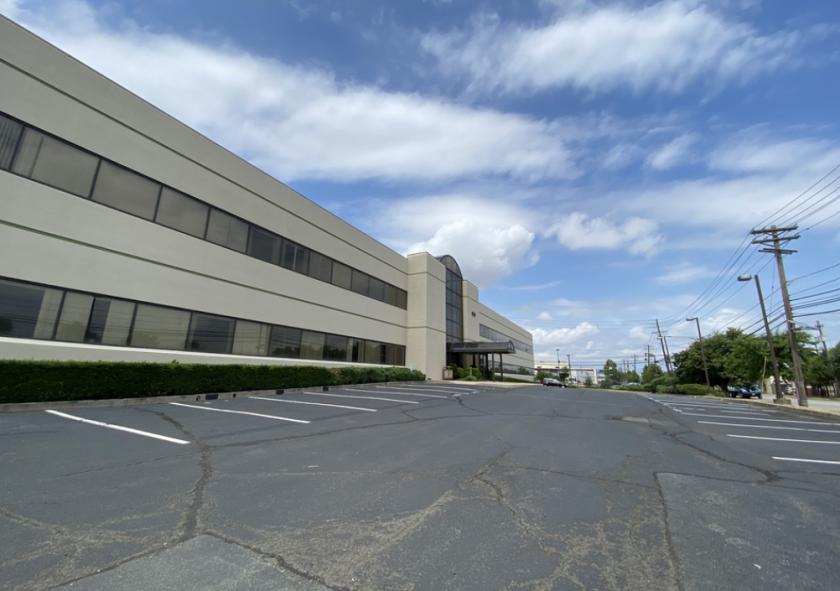
1-Mile | 3-Miles | 5-Miles | ||
---|---|---|---|---|
Total Population | 27,852 | 203,214 | 685,347 | |
Population Median Age | 35 | 36 | 37 | |
Population by Age | 0-9 Yrs | 4248 (15%) | 28569 (14%) | 91337 (13%) |
10-19 Yrs | 3779 (13%) | 27958 (13%) | 88221 (12%) | |
20-29 Yrs | 4157 (14%) | 30033 (14%) | 99471 (14%) | |
30-39 Yrs | 4239 (15%) | 29582 (14%) | 99430 (14%) | |
40-49 Yrs | 3891 (13%) | 28367 (13%) | 94581 (13%) | |
50-59 Yrs | 3258 (11%) | 25636 (12%) | 87011 (12%) | |
60-69 Yrs | 2260 (8%) | 18522 (9%) | 68612 (10%) | |
70+ Yrs | 2019 (7%) | 14548 (7%) | 56684 (8%) | |
Median HH Income | $48,447 | $51,001 | $55,345 | |
Total Household Income | < 24K | 1921 (22%) | 15425 (22%) | 59465 (24%) |
25-49K | 2505 (29%) | 17547 (26%) | 51901 (21%) | |
50-74K | 1800 (21%) | 11633 (17%) | 41238 (17%) | |
75-99K | 853 (9%) | 7855 (11%) | 28680 (11%) | |
100-199K | 1222 (14%) | 11683 (17%) | 48516 (20%) | |
200K+ | 240 (2%) | 2936 (4%) | 12056 (4%) | |
Highest Education Level | No Diploma | 4698 | 29598 | 84285 |
Diploma or GED | 6505 | 47423 | 156268 | |
Some College | 3472 | 25297 | 83253 | |
Assoc. Degree | 951 | 7037 | 26501 | |
Bachelors Degree | 1827 | 15910 | 73876 | |
Higher Degree | 605 | 7240 | 35344 | |
Total Housing Units | 9,549 | 74,069 | 267,925 | |
--Owner-Occupied | 2,044 | 22,269 | 94,734 | |
--Renter-Occupied | 6,497 | 44,811 | 147,121 | |
Owner-Occupied Values | < 100K | 126 | 952 | 4868 |
100-199K | 396 | 3627 | 13185 | |
200-299K | 850 | 7934 | 27557 | |
300-399K | 432 | 6474 | 26936 | |
400-499K | 106 | 2188 | 11506 | |
500K+ | 133 | 1094 | 10681 | |
Total Working Age Population | 21,169 | 157,761 | 539,594 | |
In Work Force | 14,415 | 105,448 | 349,239 | |
Not In Work Force | 6,754 | 52,314 | 190,355 | |
Workforce Employed | 13,611 | 97,672 | 322,843 | |
Workforce Unemployed | 805 | 7,509 | 25,905 | |
Civlian Workforce | 14,415 | 105,181 | 348,749 | |
Military Workforce | 0 | 267 | 490 | |
Total Households | 8,540 | 67,080 | 241,854 | |
Family Households | 6,328 | 46,506 | 159,532 | |
Non-Family Households | 2,212 | 20,574 | 82,323 | |
Married Couple | 3,567 | 26,212 | 92,676 | |
Other Family | 2,761 | 20,294 | 66,856 | |
Married w/Child | 1,909 | 12,255 | 42,979 | |
Single Male w/Child | 375 | 2,989 | 7,785 | |
Single Female w/Child | 1,124 | 8,239 | 26,793 |
Population Change Last Two Decades - Plus Projection
2000 | % | 2010 | % | 2020 | % | 2030 | |
---|---|---|---|---|---|---|---|
New Jersey | 8,414,350 | +4 | 8,791,894 | +4 | 9,132,700 | +4 | 9,530,900 |
Essex County | 793,633 | -1 | 783,969 | +3 | 808,300 | +3 | 829,800 |
Hudson County | 608,975 | +4 | 634,266 | +12 | 708,100 | +6 | 747,400 |
Middlesex County | 750,162 | +8 | 809,858 | +8 | 873,400 | +7 | 932,200 |
Morris County | 470,212 | +5 | 492,276 | +3 | 509,100 | +5 | 535,600 |
Union County | 522,541 | +3 | 536,499 | +7 | 573,000 | +6 | 605,600 |
New York | 18,976,457 | +2 | 19,378,102 | +4 | 20,146,131 | +2 | 20,604,030 |
Richmond County | 443,728 | +6 | 468,730 | +3 | 481,351 | +1 | 488,119 |
Total Working Age Population:
Total Households:
Total Working Age Population:
Total Households:
Total Working Age Population:
Total Households: