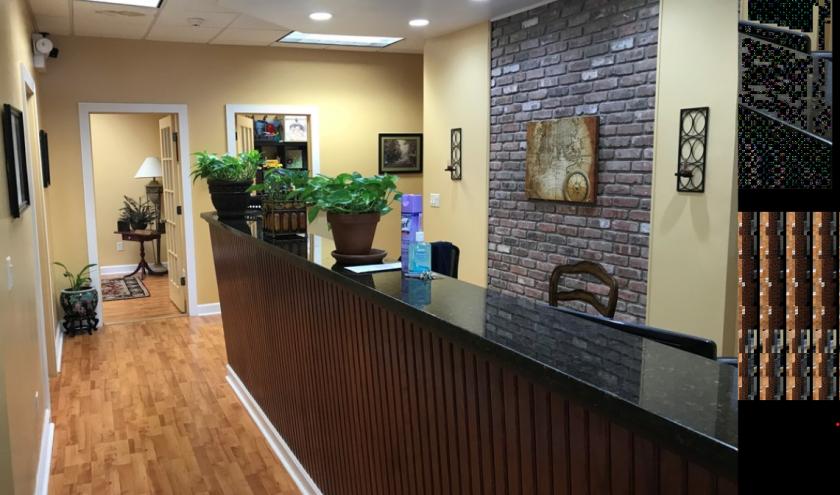
1-Mile | 3-Miles | 5-Miles | ||
---|---|---|---|---|
Total Population | 55,625 | 249,197 | 832,503 | |
Population Median Age | 36 | 35 | 37 | |
Population by Age | 0-9 Yrs | 7134 (12%) | 34838 (13%) | 113025 (13%) |
10-19 Yrs | 6106 (10%) | 33342 (13%) | 104100 (12%) | |
20-29 Yrs | 8580 (15%) | 39307 (15%) | 125686 (15%) | |
30-39 Yrs | 10572 (19%) | 40394 (16%) | 126859 (15%) | |
40-49 Yrs | 9121 (16%) | 34021 (13%) | 111328 (13%) | |
50-59 Yrs | 6221 (11%) | 29815 (11%) | 103652 (12%) | |
60-69 Yrs | 4636 (8%) | 21046 (8%) | 80934 (9%) | |
70+ Yrs | 3255 (5%) | 16433 (6%) | 66919 (8%) | |
Median HH Income | $47,235 | $40,765 | $49,150 | |
Total Household Income | < 24K | 5143 (26%) | 28611 (33%) | 83944 (27%) |
25-49K | 4904 (25%) | 21140 (24%) | 67918 (22%) | |
50-74K | 3322 (17%) | 14113 (16%) | 49484 (16%) | |
75-99K | 2214 (11%) | 8351 (9%) | 32830 (10%) | |
100-199K | 3182 (16%) | 12002 (13%) | 52421 (17%) | |
200K+ | 601 (3%) | 2469 (2%) | 13428 (4%) | |
Highest Education Level | No Diploma | 12603 | 39875 | 100955 |
Diploma or GED | 13553 | 56327 | 185144 | |
Some College | 4567 | 27315 | 100978 | |
Assoc. Degree | 1523 | 8660 | 32290 | |
Bachelors Degree | 4445 | 20255 | 93088 | |
Higher Degree | 2529 | 10754 | 44870 | |
Total Housing Units | 20,383 | 97,721 | 336,129 | |
--Owner-Occupied | 4,211 | 20,450 | 92,182 | |
--Renter-Occupied | 15,154 | 66,234 | 207,843 | |
Owner-Occupied Values | < 100K | 188 | 1398 | 6318 |
100-199K | 516 | 4084 | 16493 | |
200-299K | 1038 | 5635 | 28724 | |
300-399K | 1018 | 5025 | 22736 | |
400-499K | 730 | 2399 | 9938 | |
500K+ | 721 | 1909 | 7973 | |
Total Working Age Population | 44,274 | 194,296 | 656,813 | |
In Work Force | 29,208 | 118,242 | 423,109 | |
Not In Work Force | 15,066 | 76,055 | 233,704 | |
Workforce Employed | 27,348 | 107,150 | 384,719 | |
Workforce Unemployed | 1,860 | 11,034 | 37,892 | |
Civlian Workforce | 29,208 | 118,184 | 422,610 | |
Military Workforce | 0 | 58 | 499 | |
Total Households | 19,365 | 86,684 | 300,026 | |
Family Households | 12,568 | 53,728 | 188,187 | |
Non-Family Households | 6,797 | 32,956 | 111,839 | |
Married Couple | 8,243 | 27,224 | 100,945 | |
Other Family | 4,325 | 26,504 | 87,242 | |
Married w/Child | 3,986 | 12,516 | 45,051 | |
Single Male w/Child | 675 | 2,794 | 8,654 | |
Single Female w/Child | 1,876 | 12,028 | 35,615 |
Population Change Last Two Decades - Plus Projection
2000 | % | 2010 | % | 2020 | % | 2030 | |
---|---|---|---|---|---|---|---|
New Jersey | 8,414,350 | +4 | 8,791,894 | +4 | 9,132,700 | +4 | 9,530,900 |
Bergen County | 884,118 | +2 | 905,116 | +7 | 967,500 | +7 | 1,031,500 |
Essex County | 793,633 | -1 | 783,969 | +3 | 808,300 | +3 | 829,800 |
Hudson County | 608,975 | +4 | 634,266 | +12 | 708,100 | +6 | 747,400 |
Union County | 522,541 | +3 | 536,499 | +7 | 573,000 | +6 | 605,600 |
Total Working Age Population:
Total Households:
Total Working Age Population:
Total Households:
Total Working Age Population:
Total Households: