Industrial Properties
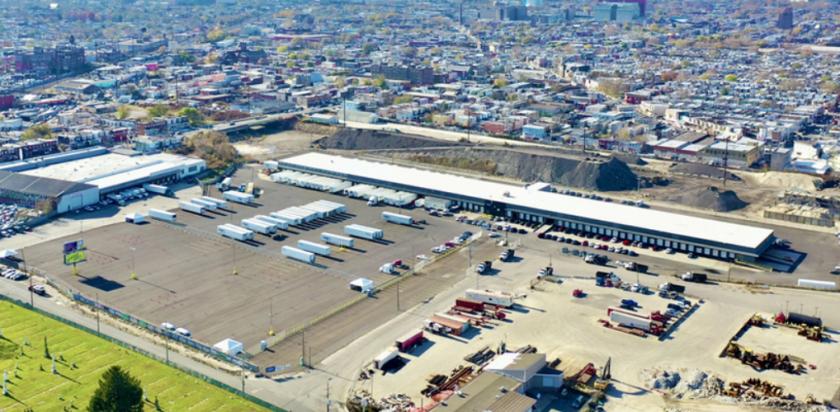
3820 North 2nd Street Philadelphia, PA 19140
3820 North 2nd Street Philadelphia, PA 19140
Details & Description
Property Highlights
- • HVAC Offices
- • Column Spacing 50 on Center, 100 Width
- • Ceiling Height 18 Clear
- • Lighting Metal Halide and Fluorescent
- • Sprinkler System Dry
Listing Agents

Jason M. Crimmins
O: 973-379-6644
M: 973-568-6611
jmcrimmins@blauberg.com
O: 973-379-6644
M: 973-568-6611
jmcrimmins@blauberg.com
While we strive to provide the most accurate information, all listing information, and demographic data, is provided by third-parties. As such, MyEListing will not be responsible for the accuracy of the information. It is strongly recommended that you verify all information with the listing agent, and any relevant agencies, prior to making any decisions.


