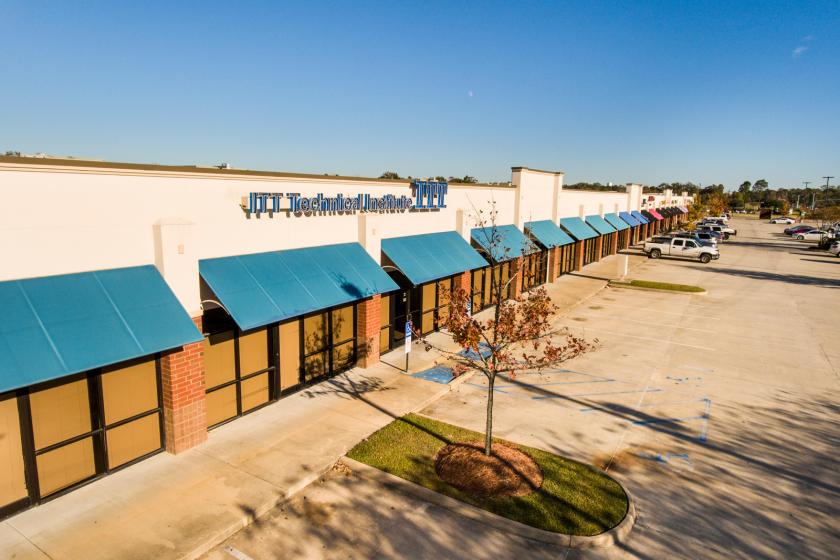
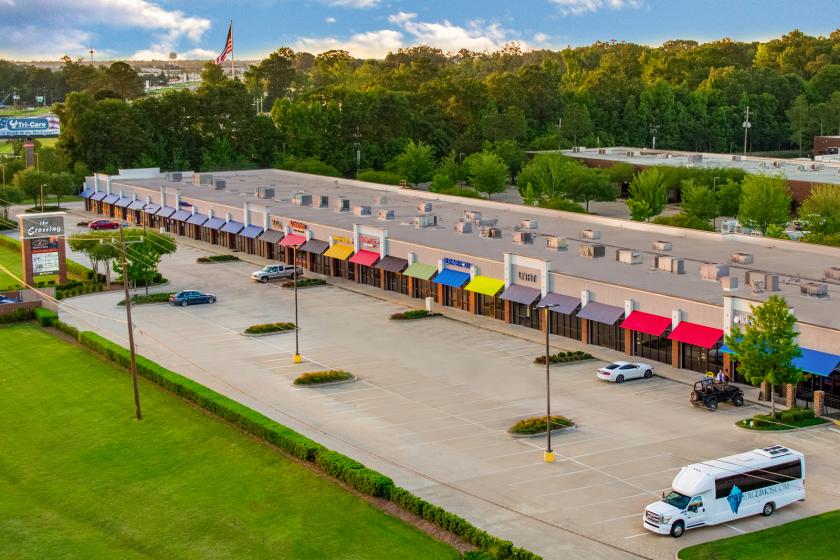
1-Mile | 3-Miles | 5-Miles | ||
---|---|---|---|---|
Total Population | 3,784 | 46,320 | 116,451 | |
Population Median Age | 35 | 38 | 39 | |
Population by Age | 0-9 Yrs | 411 (10%) | 5679 (12%) | 13510 (11%) |
10-19 Yrs | 682 (18%) | 6363 (13%) | 14202 (12%) | |
20-29 Yrs | 616 (16%) | 5965 (12%) | 17817 (15%) | |
30-39 Yrs | 416 (10%) | 6494 (14%) | 16490 (14%) | |
40-49 Yrs | 656 (17%) | 6246 (13%) | 15057 (12%) | |
50-59 Yrs | 427 (11%) | 6071 (13%) | 14958 (12%) | |
60-69 Yrs | 346 (9%) | 5491 (11%) | 13127 (11%) | |
70+ Yrs | 230 (6%) | 4011 (8%) | 11290 (9%) | |
Median HH Income | $70,078 | $86,940 | $79,985 | |
Total Household Income | < 24K | 261 (19%) | 1763 (10%) | 5668 (12%) |
25-49K | 179 (13%) | 2787 (16%) | 8362 (18%) | |
50-74K | 267 (19%) | 2983 (17%) | 7732 (16%) | |
75-99K | 122 (9%) | 2274 (13%) | 5622 (12%) | |
100-199K | 400 (29%) | 5327 (30%) | 13329 (29%) | |
200K+ | 108 (8%) | 2105 (12%) | 5053 (11%) | |
Highest Education Level | No Diploma | 181 | 1488 | 3675 |
Diploma or GED | 525 | 6008 | 15923 | |
Some College | 480 | 6965 | 18301 | |
Assoc. Degree | 193 | 2185 | 4966 | |
Bachelors Degree | 629 | 9294 | 23589 | |
Higher Degree | 281 | 5168 | 13131 | |
Total Housing Units | 1,630 | 19,062 | 51,359 | |
--Owner-Occupied | 855 | 12,744 | 31,209 | |
--Renter-Occupied | 481 | 4,497 | 14,558 | |
Owner-Occupied Values | < 100K | 56 | 463 | 1291 |
100-199K | 350 | 3542 | 8318 | |
200-299K | 133 | 4048 | 9820 | |
300-399K | 169 | 2268 | 6230 | |
400-499K | 90 | 915 | 2372 | |
500K+ | 58 | 1508 | 3178 | |
Total Working Age Population | 2,942 | 36,853 | 94,366 | |
In Work Force | 1,992 | 25,399 | 65,376 | |
Not In Work Force | 950 | 11,454 | 28,990 | |
Workforce Employed | 1,874 | 24,447 | 62,688 | |
Workforce Unemployed | 118 | 911 | 2,589 | |
Civlian Workforce | 1,992 | 25,358 | 65,277 | |
Military Workforce | 0 | 41 | 99 | |
Total Households | 1,336 | 17,240 | 45,767 | |
Family Households | 927 | 12,348 | 29,241 | |
Non-Family Households | 410 | 4,892 | 16,526 | |
Married Couple | 696 | 9,704 | 22,879 | |
Other Family | 230 | 2,644 | 6,362 | |
Married w/Child | 360 | 3,873 | 9,034 | |
Single Male w/Child | 25 | 349 | 926 | |
Single Female w/Child | 102 | 1,061 | 2,261 |
Population Change Last Two Decades - Plus Projection
2000 | % | 2010 | % | 2020 | % | 2030 | |
---|---|---|---|---|---|---|---|
Louisiana | 4,468,976 | +1 | 4,533,372 | +1 | 4,588,310 | +5 | 4,813,420 |
Ascension Parish | 76,627 | +40 | 107,215 | +38 | 147,740 | +33 | 196,140 |
East Baton Rouge Parish | 412,852 | +7 | 440,171 | -3 | 426,380 | -1 | 421,500 |
Iberville Parish | 33,320 | 0 | 33,387 | -17 | 27,830 | -11 | 24,640 |
Livingston Parish | 91,814 | +39 | 128,026 | +40 | 179,820 | +35 | 242,780 |
St. Martin Parish | 48,583 | +7 | 52,160 | +6 | 55,520 | +3 | 57,000 |
Total Working Age Population:
Total Households:
Total Working Age Population:
Total Households:
Total Working Age Population:
Total Households: