Flex-Office-Warehouse
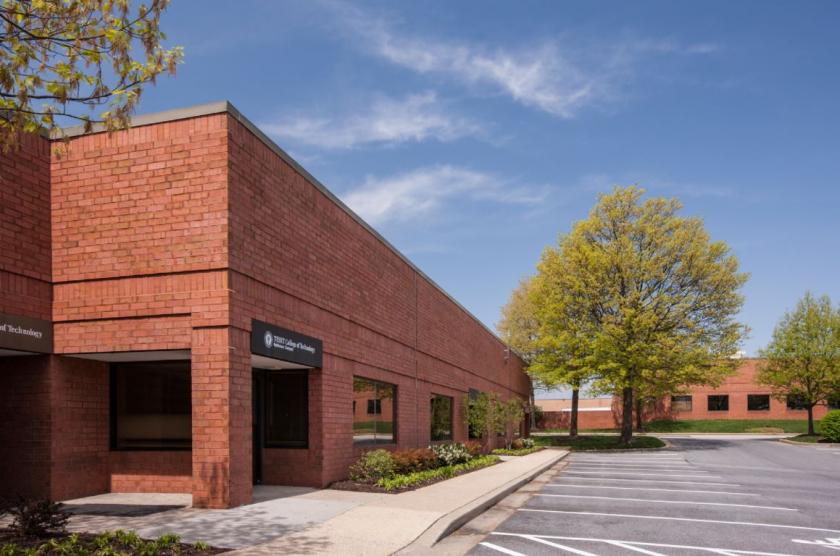
1500 Caton Center Drive Halethorpe, MD 21227
1500 Caton Center Drive Halethorpe, MD 21227
Details & Description
Property Highlights
- • Construction Brick on block
- • Ceiling Height Flex 16-20 ft. clear minimum
- • Ceiling Height BulkWarehouse 22 ft. clear minimum
- • Parking 4 per 1,000 sq. ft.
- • Zoning ML-IM
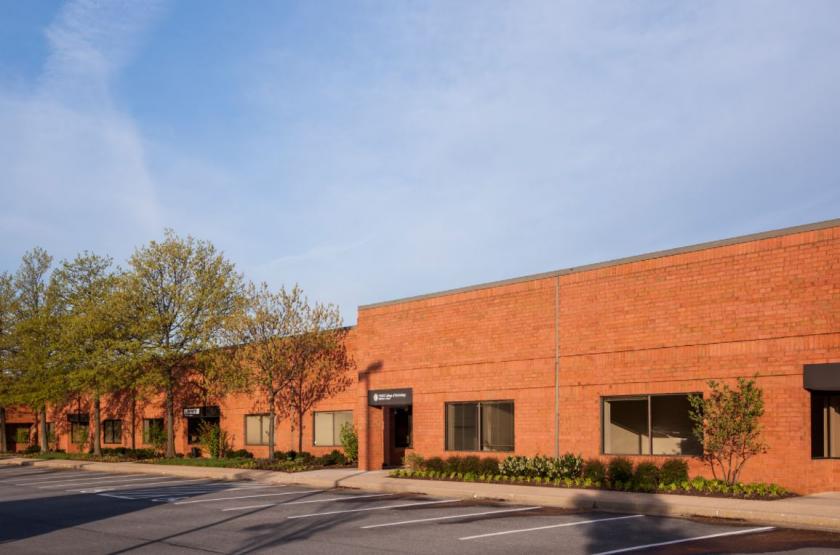
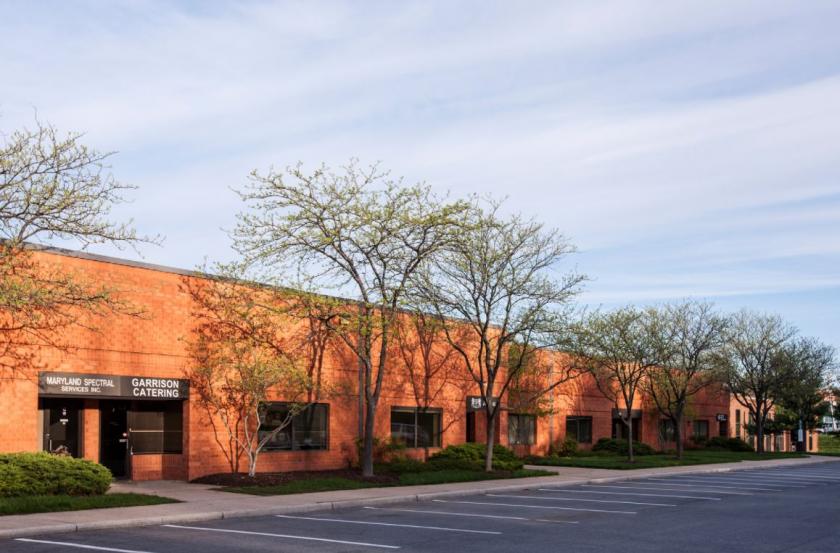
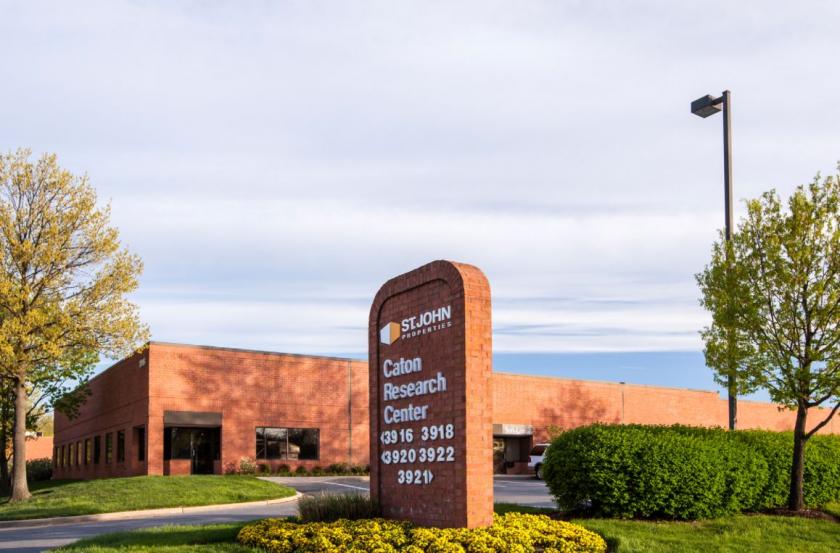
Additional Photos
Listing Agents

Claire Cobert
O: 410-369-1274
ccobert@sjpi.com
O: 410-369-1274
ccobert@sjpi.com
While we strive to provide the most accurate information, all listing information, and demographic data, is provided by third-parties. As such, MyEListing will not be responsible for the accuracy of the information. It is strongly recommended that you verify all information with the listing agent, and any relevant agencies, prior to making any decisions.


