Flex-Office-Warehouse
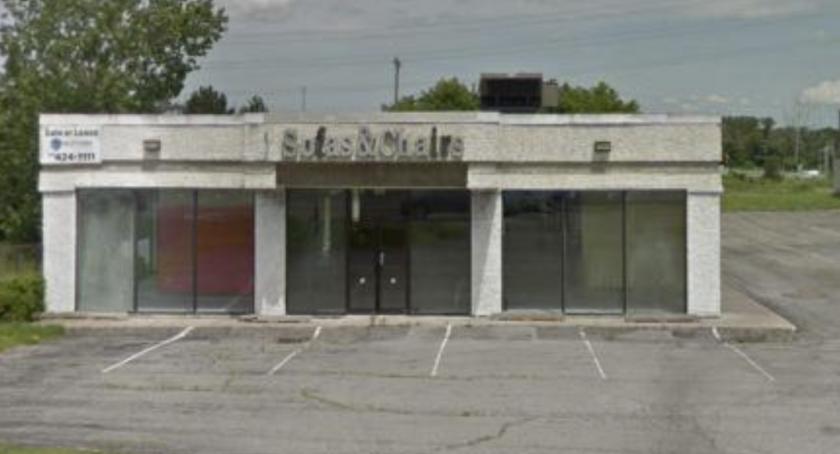
3101 Erie Boulevard East Syracuse, NY 13214
3101 Erie Boulevard East Syracuse, NY 13214
Details & Description
Property Highlights
- • 5,500 - SF showroom
- • 2,300 - SF warehouse with loading dock
- • 25 parking spaces
- • 22,700 AADT
- • Visible from Rt. 690 with 86,530 AADT
Listing Agents

Barton Feinberg
O: 315-218-1131
bfeinberg@suttoncos.com
O: 315-218-1131
bfeinberg@suttoncos.com
While we strive to provide the most accurate information, all listing information, and demographic data, is provided by third-parties. As such, MyEListing will not be responsible for the accuracy of the information. It is strongly recommended that you verify all information with the listing agent, and any relevant agencies, prior to making any decisions.


