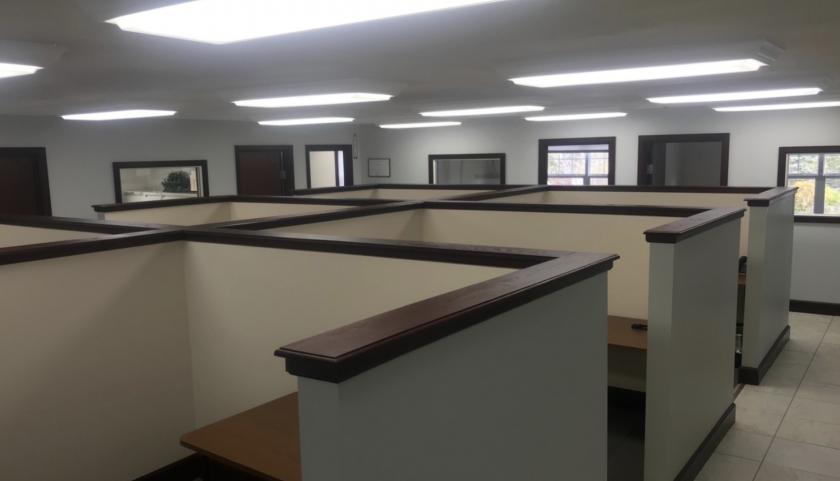
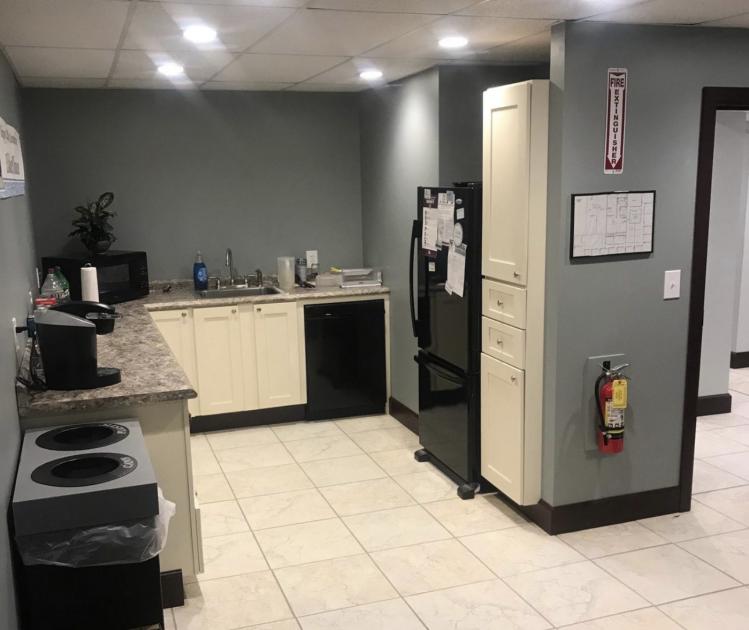
1-Mile | 3-Miles | 5-Miles | ||
---|---|---|---|---|
Total Population | 496 | 4,533 | 12,212 | |
Population Median Age | 42 | 42 | 43 | |
Population by Age | 0-9 Yrs | 39 (7%) | 332 (7%) | 838 (6%) |
10-19 Yrs | 70 (14%) | 668 (14%) | 1758 (14%) | |
20-29 Yrs | 70 (14%) | 560 (12%) | 1401 (11%) | |
30-39 Yrs | 38 (7%) | 364 (8%) | 956 (7%) | |
40-49 Yrs | 65 (13%) | 650 (14%) | 1769 (14%) | |
50-59 Yrs | 90 (18%) | 842 (18%) | 2295 (18%) | |
60-69 Yrs | 62 (12%) | 539 (11%) | 1541 (12%) | |
70+ Yrs | 62 (12%) | 577 (12%) | 1653 (13%) | |
Median HH Income | $63,551 | $64,629 | $68,425 | |
Total Household Income | < 24K | 29 (14%) | 290 (16%) | 813 (16%) |
25-49K | 35 (17%) | 368 (20%) | 1003 (20%) | |
50-74K | 52 (26%) | 373 (20%) | 817 (16%) | |
75-99K | 33 (16%) | 302 (16%) | 732 (14%) | |
100-199K | 43 (21%) | 430 (23%) | 1343 (27%) | |
200K+ | 4 (2%) | 46 (2%) | 191 (3%) | |
Highest Education Level | No Diploma | 41 | 349 | 818 |
Diploma or GED | 91 | 959 | 2730 | |
Some College | 58 | 528 | 1427 | |
Assoc. Degree | 71 | 556 | 1294 | |
Bachelors Degree | 49 | 512 | 1601 | |
Higher Degree | 34 | 314 | 964 | |
Total Housing Units | 224 | 2,037 | 5,512 | |
--Owner-Occupied | 175 | 1,528 | 4,000 | |
--Renter-Occupied | 22 | 281 | 899 | |
Owner-Occupied Values | < 100K | 59 | 510 | 1157 |
100-199K | 75 | 648 | 1692 | |
200-299K | 27 | 248 | 740 | |
300-399K | 5 | 51 | 215 | |
400-499K | 1 | 25 | 108 | |
500K+ | 8 | 46 | 87 | |
Total Working Age Population | 418 | 3,825 | 10,377 | |
In Work Force | 278 | 2,482 | 6,506 | |
Not In Work Force | 141 | 1,344 | 3,870 | |
Workforce Employed | 258 | 2,340 | 6,184 | |
Workforce Unemployed | 19 | 142 | 321 | |
Civlian Workforce | 278 | 2,482 | 6,505 | |
Military Workforce | 0 | 0 | 1 | |
Total Households | 197 | 1,810 | 4,899 | |
Family Households | 139 | 1,245 | 3,353 | |
Non-Family Households | 57 | 564 | 1,546 | |
Married Couple | 99 | 893 | 2,500 | |
Other Family | 40 | 352 | 854 | |
Married w/Child | 24 | 251 | 727 | |
Single Male w/Child | 6 | 47 | 116 | |
Single Female w/Child | 23 | 184 | 402 |
Population Change Last Two Decades - Plus Projection
2000 | % | 2010 | % | 2020 | % | 2030 | |
---|---|---|---|---|---|---|---|
New York | 18,976,457 | +2 | 19,378,102 | +4 | 20,146,131 | +2 | 20,604,030 |
Cayuga County | 81,963 | -2 | 80,026 | -4 | 77,069 | -3 | 74,724 |
Onondaga County | 458,336 | +2 | 467,026 | 0 | 467,461 | -1 | 463,795 |
Total Working Age Population:
Total Households:
Total Working Age Population:
Total Households:
Total Working Age Population:
Total Households: