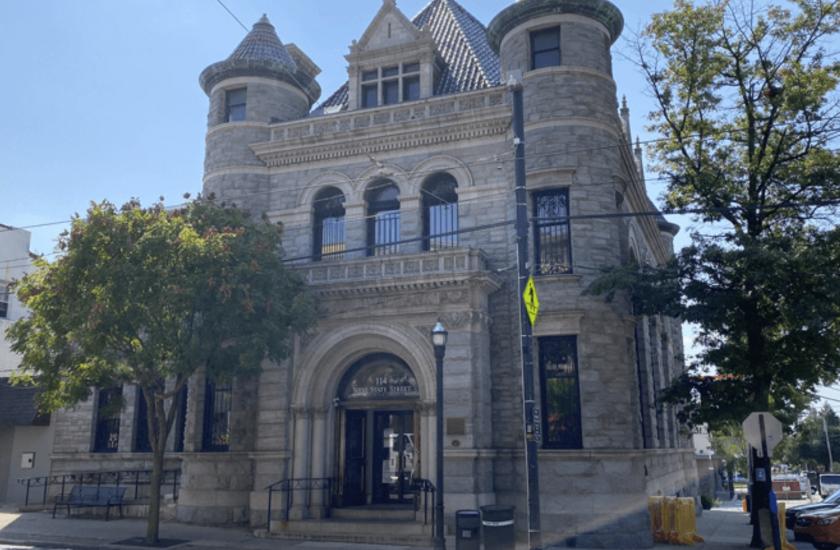
1-Mile | 3-Miles | 5-Miles | ||
---|---|---|---|---|
Total Population | 11,468 | 59,275 | 235,594 | |
Population Median Age | 41 | 42 | 41 | |
Population by Age | 0-9 Yrs | 1173 (10%) | 6641 (11%) | 27809 (11%) |
10-19 Yrs | 1093 (9%) | 6987 (11%) | 28282 (12%) | |
20-29 Yrs | 1371 (11%) | 6260 (10%) | 29538 (12%) | |
30-39 Yrs | 1918 (16%) | 6566 (11%) | 29569 (12%) | |
40-49 Yrs | 1490 (12%) | 7389 (12%) | 27483 (11%) | |
50-59 Yrs | 1607 (14%) | 8725 (14%) | 33353 (14%) | |
60-69 Yrs | 1596 (13%) | 8128 (13%) | 29679 (12%) | |
70+ Yrs | 1220 (10%) | 8579 (14%) | 29881 (12%) | |
Median HH Income | $92,506 | $104,670 | $82,589 | |
Total Household Income | < 24K | 494 (9%) | 2069 (8%) | 12162 (13%) |
25-49K | 866 (16%) | 3129 (13%) | 15399 (17%) | |
50-74K | 815 (15%) | 3206 (13%) | 13588 (15%) | |
75-99K | 559 (10%) | 2661 (11%) | 11805 (13%) | |
100-199K | 1705 (33%) | 7716 (33%) | 26464 (29%) | |
200K+ | 694 (13%) | 4347 (18%) | 10049 (11%) | |
Highest Education Level | No Diploma | 279 | 1112 | 9180 |
Diploma or GED | 1284 | 8130 | 48600 | |
Some College | 1304 | 6147 | 27195 | |
Assoc. Degree | 619 | 2944 | 13535 | |
Bachelors Degree | 2625 | 11800 | 37628 | |
Higher Degree | 2491 | 12210 | 28669 | |
Total Housing Units | 5,436 | 24,391 | 95,964 | |
--Owner-Occupied | 2,926 | 17,912 | 65,117 | |
--Renter-Occupied | 2,207 | 5,216 | 24,351 | |
Owner-Occupied Values | < 100K | 77 | 730 | 5290 |
100-199K | 250 | 1692 | 14809 | |
200-299K | 574 | 3609 | 18023 | |
300-399K | 849 | 4724 | 14074 | |
400-499K | 570 | 3179 | 6297 | |
500K+ | 607 | 3978 | 6624 | |
Total Working Age Population | 9,546 | 48,533 | 191,251 | |
In Work Force | 7,093 | 31,915 | 125,859 | |
Not In Work Force | 2,453 | 16,617 | 65,391 | |
Workforce Employed | 6,759 | 30,468 | 119,436 | |
Workforce Unemployed | 332 | 1,417 | 6,361 | |
Civlian Workforce | 7,091 | 31,885 | 125,797 | |
Military Workforce | 3 | 30 | 63 | |
Total Households | 5,133 | 23,128 | 89,468 | |
Family Households | 2,792 | 15,458 | 59,643 | |
Non-Family Households | 2,341 | 7,671 | 29,825 | |
Married Couple | 2,239 | 13,107 | 45,241 | |
Other Family | 552 | 2,350 | 14,402 | |
Married w/Child | 894 | 5,170 | 18,207 | |
Single Male w/Child | 68 | 396 | 1,929 | |
Single Female w/Child | 148 | 544 | 4,651 |
Population Change Last Two Decades - Plus Projection
2000 | % | 2010 | % | 2020 | % | 2030 | |
---|---|---|---|---|---|---|---|
New Jersey | 8,414,350 | +4 | 8,791,894 | +4 | 9,132,700 | +4 | 9,530,900 |
Gloucester County | 254,673 | +13 | 288,288 | +1 | 292,000 | +5 | 305,800 |
Pennsylvania | 12,281,054 | +3 | 12,702,379 | +4 | 13,230,170 | +4 | 13,759,594 |
Chester County | 433,501 | +15 | 498,886 | +7 | 533,837 | +7 | 573,576 |
Delaware County | 550,864 | +1 | 558,979 | +5 | 588,436 | +6 | 622,307 |
Montgomery County | 750,097 | +7 | 799,874 | +5 | 838,883 | +6 | 891,868 |
Total Working Age Population:
Total Households:
Total Working Age Population:
Total Households:
Total Working Age Population:
Total Households: