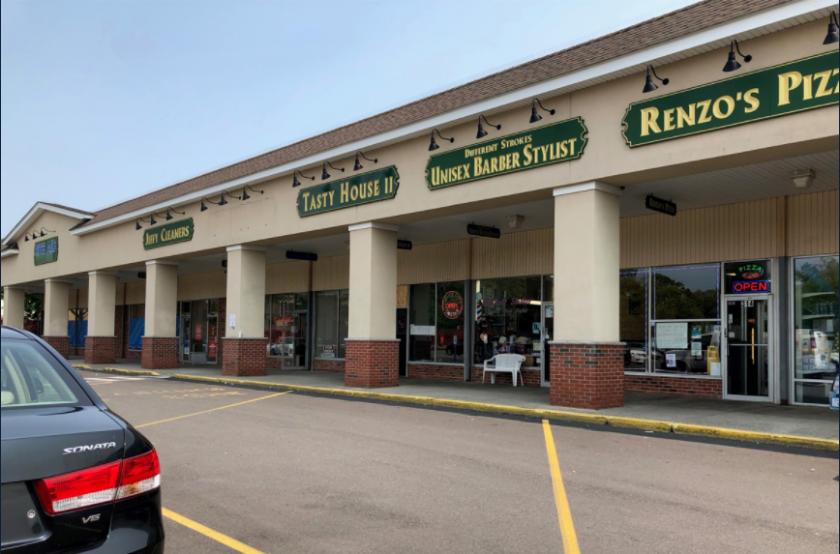
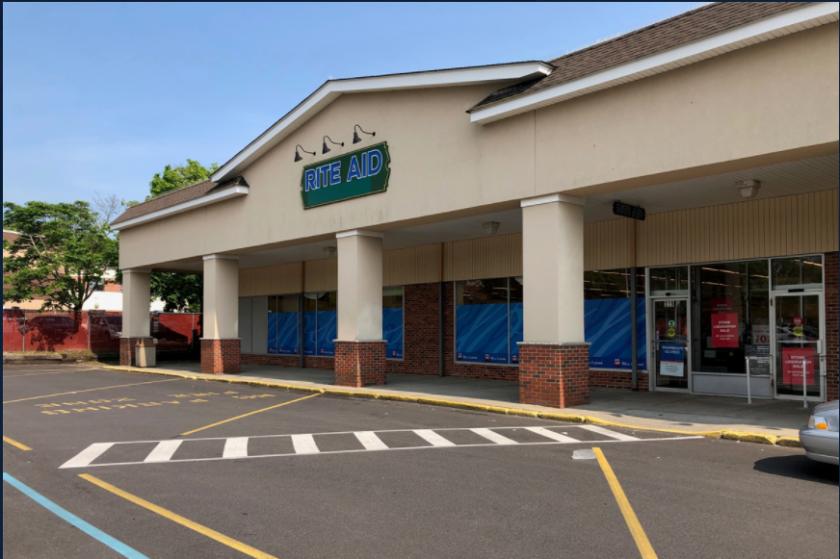
1-Mile | 3-Miles | 5-Miles | ||
---|---|---|---|---|
Total Population | 10,837 | 58,737 | 183,304 | |
Population Median Age | 39 | 40 | 38 | |
Population by Age | 0-9 Yrs | 1473 (13%) | 6075 (10%) | 22195 (12%) |
10-19 Yrs | 1300 (11%) | 7594 (12%) | 25209 (13%) | |
20-29 Yrs | 1479 (13%) | 7834 (13%) | 25769 (14%) | |
30-39 Yrs | 752 (6%) | 5898 (10%) | 22150 (12%) | |
40-49 Yrs | 1672 (15%) | 8581 (14%) | 26275 (14%) | |
50-59 Yrs | 1801 (16%) | 9415 (16%) | 26336 (14%) | |
60-69 Yrs | 1304 (12%) | 6904 (11%) | 18700 (10%) | |
70+ Yrs | 1056 (9%) | 6435 (10%) | 16669 (9%) | |
Median HH Income | $120,030 | $108,891 | $95,774 | |
Total Household Income | < 24K | 197 (5%) | 1603 (8%) | 6021 (10%) |
25-49K | 324 (9%) | 2394 (12%) | 7377 (13%) | |
50-74K | 500 (14%) | 2710 (13%) | 7838 (14%) | |
75-99K | 500 (14%) | 2498 (12%) | 7415 (13%) | |
100-199K | 1305 (37%) | 7173 (36%) | 18526 (33%) | |
200K+ | 685 (19%) | 3455 (17%) | 7620 (13%) | |
Highest Education Level | No Diploma | 404 | 3411 | 19891 |
Diploma or GED | 2269 | 11177 | 34839 | |
Some College | 1317 | 7339 | 21752 | |
Assoc. Degree | 819 | 4017 | 10409 | |
Bachelors Degree | 1473 | 8227 | 19630 | |
Higher Degree | 1223 | 6908 | 15937 | |
Total Housing Units | 3,686 | 23,067 | 75,964 | |
--Owner-Occupied | 2,971 | 16,616 | 41,491 | |
--Renter-Occupied | 539 | 3,217 | 13,307 | |
Owner-Occupied Values | < 100K | 20 | 345 | 1165 |
100-199K | 103 | 875 | 2123 | |
200-299K | 160 | 1848 | 8788 | |
300-399K | 1175 | 6016 | 14422 | |
400-499K | 769 | 3955 | 8160 | |
500K+ | 745 | 3577 | 6833 | |
Total Working Age Population | 8,646 | 48,470 | 146,115 | |
In Work Force | 5,425 | 32,138 | 98,024 | |
Not In Work Force | 3,222 | 16,331 | 48,091 | |
Workforce Employed | 5,282 | 30,860 | 93,921 | |
Workforce Unemployed | 142 | 1,258 | 4,013 | |
Civlian Workforce | 5,424 | 32,119 | 97,934 | |
Military Workforce | 0 | 20 | 90 | |
Total Households | 3,511 | 19,833 | 54,798 | |
Family Households | 2,612 | 14,185 | 40,535 | |
Non-Family Households | 898 | 5,648 | 14,263 | |
Married Couple | 2,052 | 11,197 | 29,553 | |
Other Family | 561 | 2,988 | 10,982 | |
Married w/Child | 976 | 4,763 | 13,262 | |
Single Male w/Child | 52 | 342 | 1,263 | |
Single Female w/Child | 117 | 684 | 2,940 |
Population Change Last Two Decades - Plus Projection
2000 | % | 2010 | % | 2020 | % | 2030 | |
---|---|---|---|---|---|---|---|
New York | 18,976,457 | +2 | 19,378,102 | +4 | 20,146,131 | +2 | 20,604,030 |
Suffolk County | 1,419,369 | +5 | 1,493,350 | 0 | 1,497,391 | -1 | 1,488,885 |
Total Working Age Population:
Total Households:
Total Working Age Population:
Total Households:
Total Working Age Population:
Total Households: