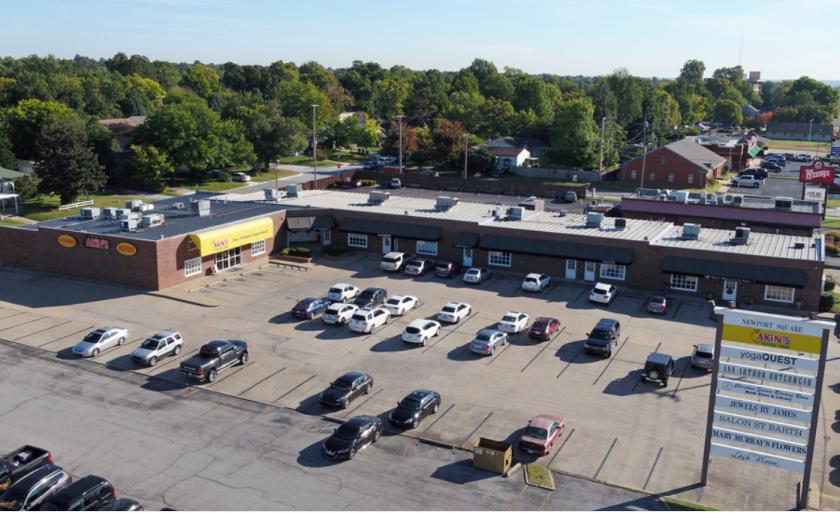
Retail Space
3321 East 31st Street Tulsa, OK 74135
3321 East 31st Street Tulsa, OK 74135
Details & Description
Property Highlights
- • Excellent Midtown location
- • Zoning CH High Density Commercial Use
- • Great visibility to 31st Str
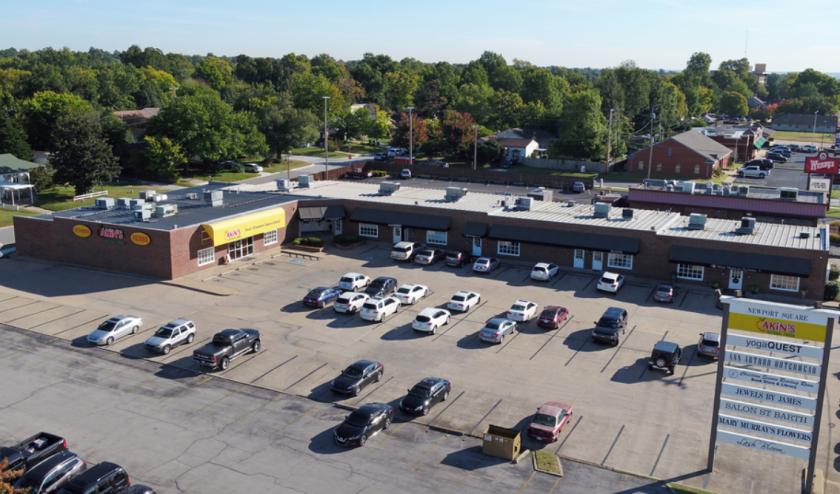
Additional Photos


Listing Agents

Julie Buxton
O: 918-398-2824
M: 214-500-4713
jbuxton@mcgrawcp.com
O: 918-398-2824
M: 214-500-4713
jbuxton@mcgrawcp.com
While we strive to provide the most accurate information, all listing information, and demographic data, is provided by third-parties. As such, MyEListing will not be responsible for the accuracy of the information. It is strongly recommended that you verify all information with the listing agent, and any relevant agencies, prior to making any decisions.


