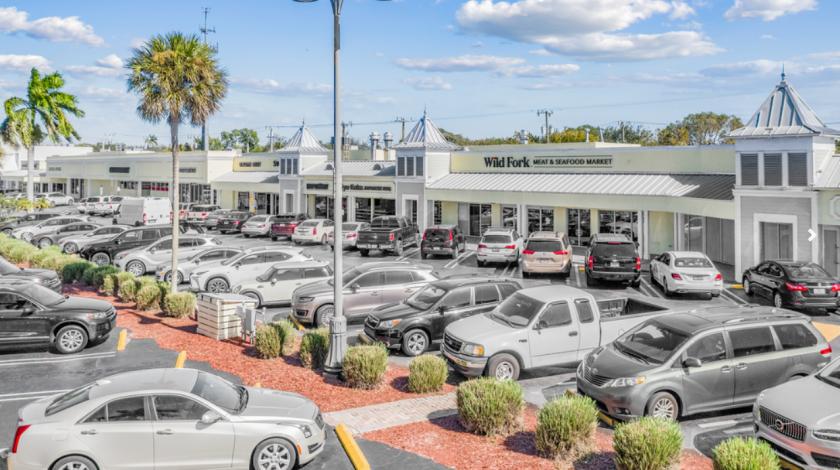
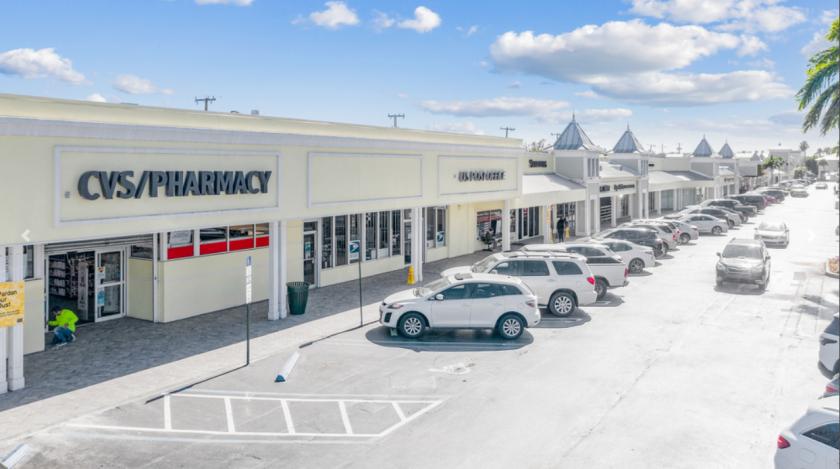
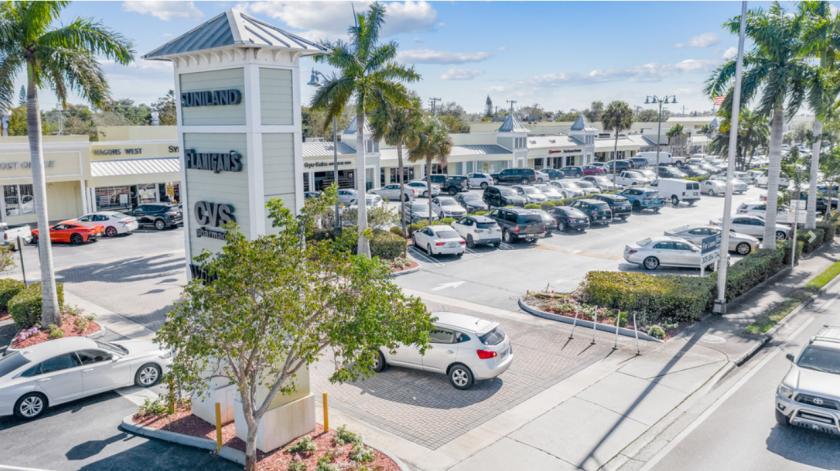
1-Mile | 3-Miles | 5-Miles | ||
---|---|---|---|---|
Total Population | 9,251 | 92,727 | 280,264 | |
Population Median Age | 41 | 40 | 40 | |
Population by Age | 0-9 Yrs | 995 (10%) | 9969 (10%) | 29493 (10%) |
10-19 Yrs | 1120 (12%) | 11508 (12%) | 35495 (12%) | |
20-29 Yrs | 1229 (13%) | 12429 (13%) | 38943 (13%) | |
30-39 Yrs | 1019 (11%) | 11418 (12%) | 33327 (11%) | |
40-49 Yrs | 1184 (12%) | 11857 (12%) | 37704 (13%) | |
50-59 Yrs | 1491 (16%) | 14498 (15%) | 40755 (14%) | |
60-69 Yrs | 1262 (13%) | 10555 (11%) | 30730 (10%) | |
70+ Yrs | 952 (10%) | 10494 (11%) | 33818 (12%) | |
Median HH Income | $122,007 | $95,416 | $78,494 | |
Total Household Income | < 24K | 179 (6%) | 4297 (13%) | 14213 (15%) |
25-49K | 334 (11%) | 4919 (15%) | 15743 (17%) | |
50-74K | 351 (12%) | 4289 (13%) | 13818 (15%) | |
75-99K | 252 (8%) | 3413 (10%) | 10565 (11%) | |
100-199K | 978 (33%) | 8141 (24%) | 21596 (23%) | |
200K+ | 796 (27%) | 7526 (23%) | 14568 (16%) | |
Highest Education Level | No Diploma | 261 | 3366 | 17745 |
Diploma or GED | 1016 | 9849 | 39582 | |
Some College | 930 | 9990 | 32007 | |
Assoc. Degree | 546 | 5803 | 18180 | |
Bachelors Degree | 1946 | 19582 | 49948 | |
Higher Degree | 1872 | 16835 | 38146 | |
Total Housing Units | 3,218 | 35,956 | 98,910 | |
--Owner-Occupied | 2,306 | 21,619 | 61,427 | |
--Renter-Occupied | 583 | 10,965 | 29,076 | |
Owner-Occupied Values | < 100K | 37 | 486 | 1535 |
100-199K | 49 | 1739 | 7164 | |
200-299K | 210 | 1538 | 11092 | |
300-399K | 100 | 1952 | 10142 | |
400-499K | 160 | 2422 | 6873 | |
500K+ | 1751 | 13483 | 24621 | |
Total Working Age Population | 7,547 | 75,306 | 230,609 | |
In Work Force | 4,718 | 49,548 | 145,435 | |
Not In Work Force | 2,829 | 25,758 | 85,174 | |
Workforce Employed | 4,581 | 47,487 | 138,878 | |
Workforce Unemployed | 137 | 2,019 | 6,487 | |
Civlian Workforce | 4,718 | 49,506 | 145,366 | |
Military Workforce | 0 | 42 | 69 | |
Total Households | 2,890 | 32,584 | 90,503 | |
Family Households | 2,242 | 23,057 | 65,809 | |
Non-Family Households | 648 | 9,527 | 24,694 | |
Married Couple | 1,875 | 18,029 | 47,747 | |
Other Family | 367 | 5,028 | 18,062 | |
Married w/Child | 705 | 7,196 | 19,359 | |
Single Male w/Child | 0 | 406 | 1,490 | |
Single Female w/Child | 103 | 1,392 | 4,762 |
Population Change Last Two Decades - Plus Projection
2000 | % | 2010 | % | 2020 | % | 2030 | |
---|---|---|---|---|---|---|---|
Florida | 15,982,378 | +18 | 18,801,310 | +14 | 21,517,610 | +13 | 24,340,457 |
Miami-Dade County | 2,253,362 | +11 | 2,496,435 | +15 | 2,861,579 | +11 | 3,190,242 |
Monroe County | 79,589 | -8 | 73,090 | +1 | 74,004 | 0 | 74,301 |
Total Working Age Population:
Total Households:
Total Working Age Population:
Total Households:
Total Working Age Population:
Total Households: