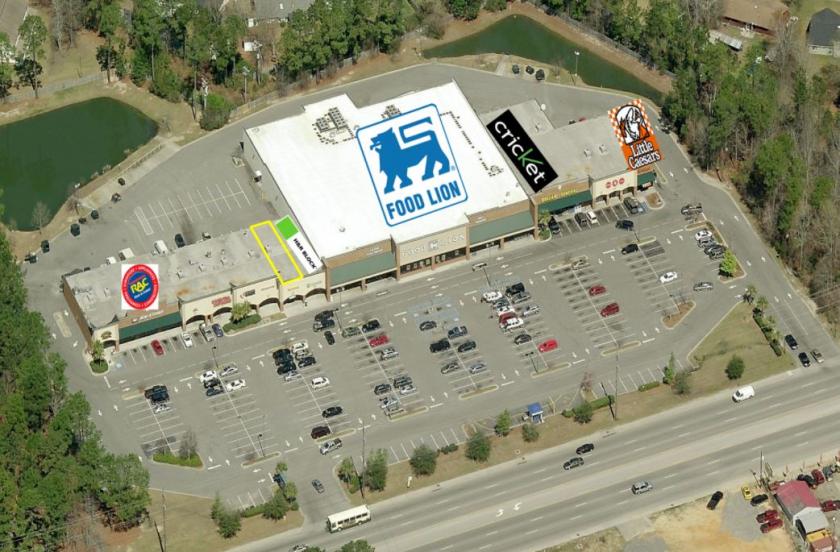
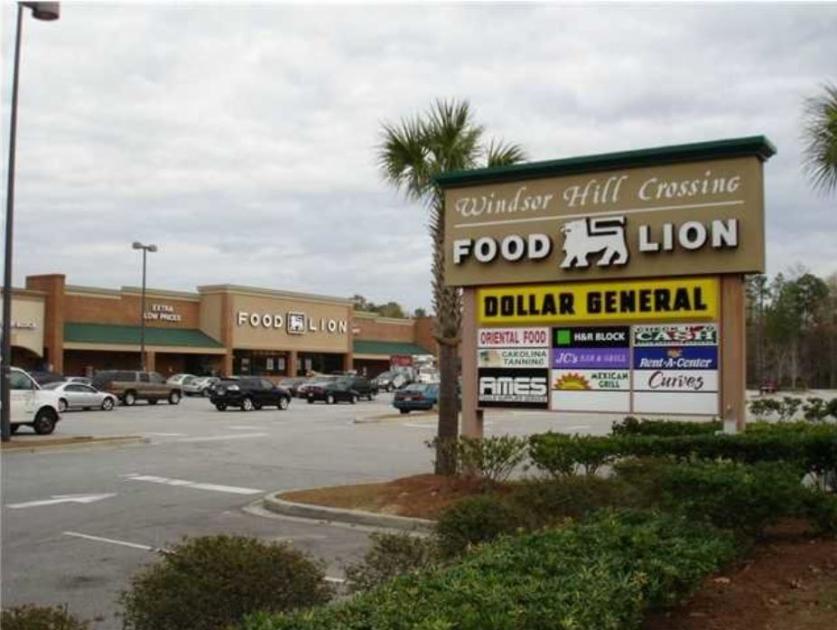
1-Mile | 3-Miles | 5-Miles | ||
---|---|---|---|---|
Total Population | 7,131 | 51,401 | 126,176 | |
Population Median Age | 36 | 36 | 35 | |
Population by Age | 0-9 Yrs | 746 (10%) | 6946 (13%) | 18680 (14%) |
10-19 Yrs | 1029 (14%) | 6508 (12%) | 16729 (13%) | |
20-29 Yrs | 1050 (14%) | 8665 (16%) | 20366 (16%) | |
30-39 Yrs | 1243 (17%) | 7919 (15%) | 19460 (15%) | |
40-49 Yrs | 1177 (16%) | 6985 (13%) | 15744 (12%) | |
50-59 Yrs | 822 (11%) | 6132 (11%) | 14888 (11%) | |
60-69 Yrs | 669 (9%) | 4889 (9%) | 11050 (8%) | |
70+ Yrs | 395 (5%) | 3358 (6%) | 9258 (7%) | |
Median HH Income | $45,091 | $55,699 | $56,806 | |
Total Household Income | < 24K | 783 (27%) | 4115 (20%) | 9783 (20%) |
25-49K | 776 (27%) | 4756 (24%) | 11093 (23%) | |
50-74K | 587 (20%) | 4224 (21%) | 9764 (20%) | |
75-99K | 408 (14%) | 2576 (13%) | 6763 (14%) | |
100-199K | 193 (6%) | 3396 (17%) | 8549 (18%) | |
200K+ | 79 (2%) | 716 (3%) | 1531 (3%) | |
Highest Education Level | No Diploma | 793 | 4358 | 9682 |
Diploma or GED | 1502 | 8796 | 21550 | |
Some College | 977 | 7598 | 18616 | |
Assoc. Degree | 543 | 3945 | 9417 | |
Bachelors Degree | 880 | 6864 | 16124 | |
Higher Degree | 238 | 2955 | 6971 | |
Total Housing Units | 3,056 | 21,547 | 51,435 | |
--Owner-Occupied | 1,592 | 10,846 | 26,762 | |
--Renter-Occupied | 1,235 | 8,936 | 20,721 | |
Owner-Occupied Values | < 100K | 180 | 1508 | 4021 |
100-199K | 1136 | 4985 | 10711 | |
200-299K | 185 | 3070 | 8129 | |
300-399K | 51 | 657 | 2571 | |
400-499K | 23 | 354 | 664 | |
500K+ | 16 | 271 | 666 | |
Total Working Age Population | 5,776 | 40,289 | 97,144 | |
In Work Force | 3,723 | 28,264 | 67,695 | |
Not In Work Force | 2,053 | 12,025 | 29,449 | |
Workforce Employed | 3,488 | 25,555 | 62,315 | |
Workforce Unemployed | 159 | 1,162 | 2,577 | |
Civlian Workforce | 3,648 | 26,717 | 64,893 | |
Military Workforce | 76 | 1,547 | 2,802 | |
Total Households | 2,827 | 19,782 | 47,483 | |
Family Households | 1,683 | 11,661 | 28,509 | |
Non-Family Households | 1,144 | 8,121 | 18,975 | |
Married Couple | 999 | 8,099 | 19,525 | |
Other Family | 683 | 3,562 | 8,983 | |
Married w/Child | 349 | 3,162 | 8,243 | |
Single Male w/Child | 22 | 359 | 1,016 | |
Single Female w/Child | 379 | 1,618 | 3,981 |
Population Change Last Two Decades - Plus Projection
2000 | % | 2010 | % | 2020 | % | 2030 | |
---|---|---|---|---|---|---|---|
South Carolina | 4,012,012 | +15 | 4,625,364 | +9 | 5,020,400 | +9 | 5,488,460 |
Berkeley County | 142,651 | +25 | 177,843 | +8 | 192,450 | +11 | 214,140 |
Charleston County | 309,969 | +13 | 350,209 | +5 | 366,380 | +6 | 386,660 |
Dorchester County | 96,413 | +42 | 136,555 | +9 | 149,300 | +14 | 170,210 |
Total Working Age Population:
Total Households:
Total Working Age Population:
Total Households:
Total Working Age Population:
Total Households: