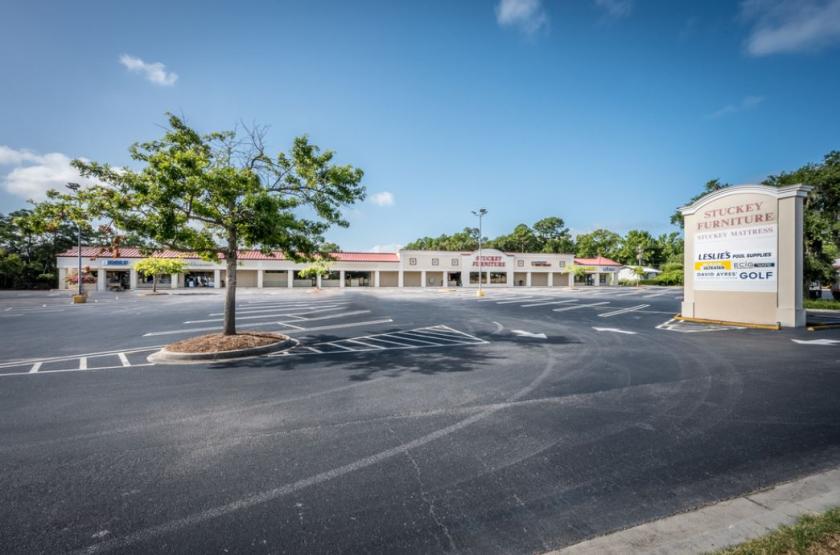
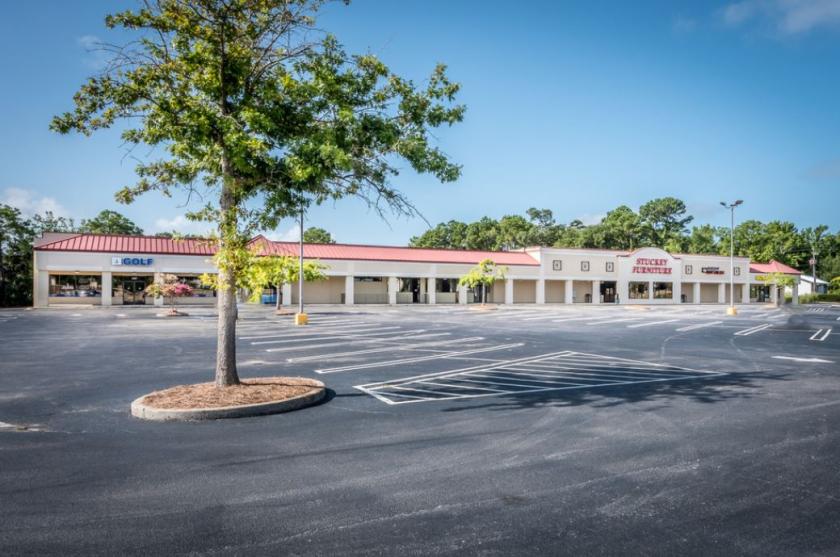
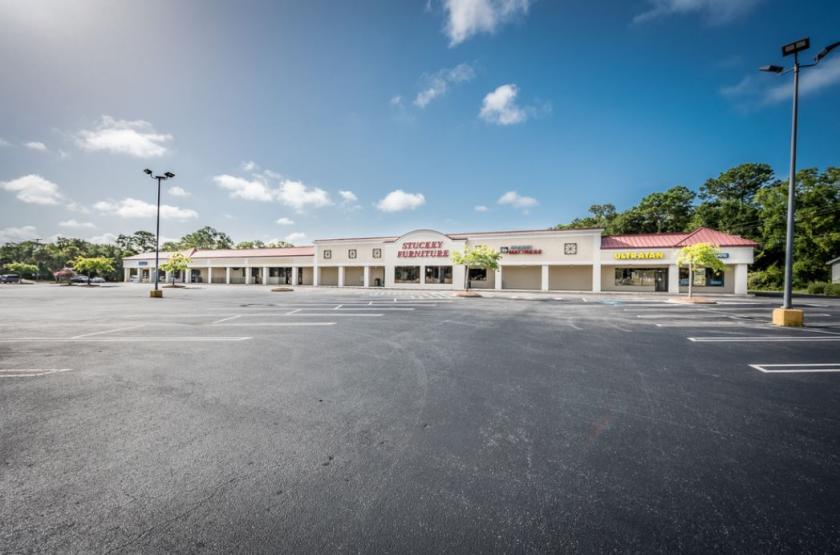
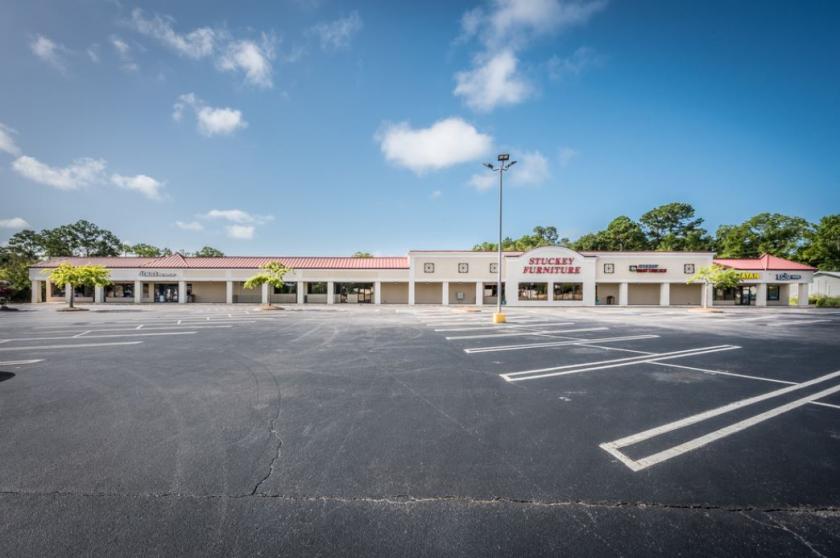
1-Mile | 3-Miles | 5-Miles | ||
---|---|---|---|---|
Total Population | 8,653 | 53,963 | 102,220 | |
Population Median Age | 43 | 41 | 40 | |
Population by Age | 0-9 Yrs | 597 (6%) | 6459 (11%) | 12241 (11%) |
10-19 Yrs | 715 (8%) | 4887 (9%) | 11465 (11%) | |
20-29 Yrs | 1594 (18%) | 6654 (12%) | 13062 (12%) | |
30-39 Yrs | 1345 (15%) | 7840 (14%) | 13108 (12%) | |
40-49 Yrs | 911 (10%) | 7131 (13%) | 12842 (12%) | |
50-59 Yrs | 937 (10%) | 8296 (15%) | 15073 (14%) | |
60-69 Yrs | 1168 (13%) | 6074 (11%) | 12213 (11%) | |
70+ Yrs | 1386 (16%) | 6621 (12%) | 12217 (11%) | |
Median HH Income | $72,194 | $93,511 | $94,936 | |
Total Household Income | < 24K | 726 (18%) | 2234 (9%) | 4965 (11%) |
25-49K | 677 (17%) | 3373 (14%) | 5856 (14%) | |
50-74K | 625 (15%) | 3250 (14%) | 5556 (13%) | |
75-99K | 483 (12%) | 3416 (15%) | 5540 (13%) | |
100-199K | 944 (24%) | 6441 (28%) | 11682 (28%) | |
200K+ | 459 (11%) | 4058 (17%) | 7992 (19%) | |
Highest Education Level | No Diploma | 286 | 1425 | 2763 |
Diploma or GED | 1146 | 5155 | 8823 | |
Some College | 1103 | 6081 | 9995 | |
Assoc. Degree | 352 | 2681 | 4570 | |
Bachelors Degree | 2114 | 15600 | 28618 | |
Higher Degree | 1464 | 9462 | 18348 | |
Total Housing Units | 4,305 | 24,810 | 48,416 | |
--Owner-Occupied | 1,980 | 15,057 | 27,934 | |
--Renter-Occupied | 1,935 | 7,715 | 13,657 | |
Owner-Occupied Values | < 100K | 59 | 267 | 561 |
100-199K | 163 | 648 | 1048 | |
200-299K | 327 | 1684 | 2497 | |
300-399K | 412 | 2672 | 4545 | |
400-499K | 382 | 2056 | 3686 | |
500K+ | 638 | 7730 | 15598 | |
Total Working Age Population | 7,618 | 44,275 | 83,813 | |
In Work Force | 5,063 | 31,241 | 55,711 | |
Not In Work Force | 2,555 | 13,034 | 28,102 | |
Workforce Employed | 4,883 | 30,151 | 53,277 | |
Workforce Unemployed | 109 | 805 | 1,961 | |
Civlian Workforce | 4,991 | 30,956 | 55,238 | |
Military Workforce | 71 | 284 | 473 | |
Total Households | 3,915 | 22,772 | 41,592 | |
Family Households | 1,850 | 13,604 | 25,604 | |
Non-Family Households | 2,064 | 9,168 | 15,987 | |
Married Couple | 1,440 | 11,433 | 21,382 | |
Other Family | 410 | 2,170 | 4,223 | |
Married w/Child | 440 | 4,451 | 8,468 | |
Single Male w/Child | 48 | 222 | 442 | |
Single Female w/Child | 152 | 839 | 1,736 |
Population Change Last Two Decades - Plus Projection
2000 | % | 2010 | % | 2020 | % | 2030 | |
---|---|---|---|---|---|---|---|
South Carolina | 4,012,012 | +15 | 4,625,364 | +9 | 5,020,400 | +9 | 5,488,460 |
Berkeley County | 142,651 | +25 | 177,843 | +8 | 192,450 | +11 | 214,140 |
Charleston County | 309,969 | +13 | 350,209 | +5 | 366,380 | +6 | 386,660 |
Total Working Age Population:
Total Households:
Total Working Age Population:
Total Households:
Total Working Age Population:
Total Households: