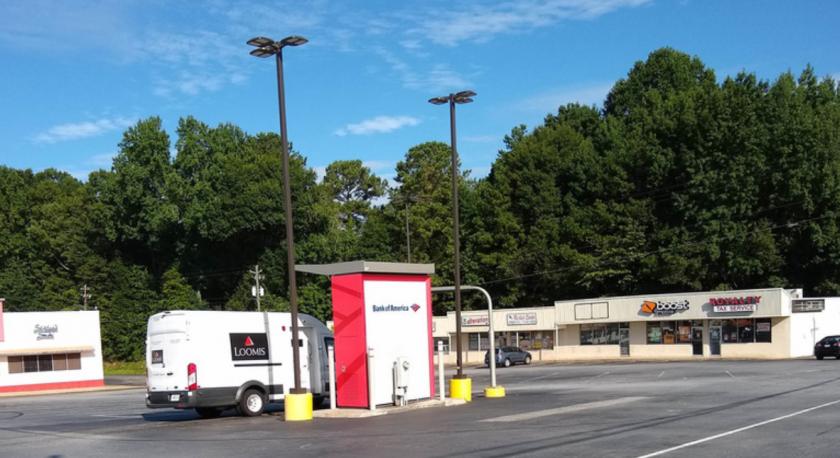
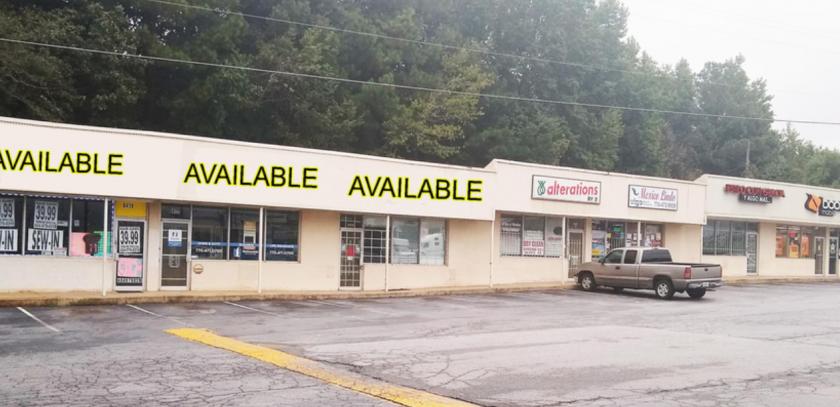
1-Mile | 3-Miles | 5-Miles | ||
---|---|---|---|---|
Total Population | 11,649 | 80,769 | 195,129 | |
Population Median Age | 29 | 32 | 34 | |
Population by Age | 0-9 Yrs | 2474 (21%) | 13390 (16%) | 30986 (15%) |
10-19 Yrs | 1945 (16%) | 12712 (15%) | 29105 (14%) | |
20-29 Yrs | 2102 (18%) | 14435 (17%) | 32925 (16%) | |
30-39 Yrs | 1383 (11%) | 11896 (14%) | 27139 (13%) | |
40-49 Yrs | 1586 (13%) | 9991 (12%) | 24754 (12%) | |
50-59 Yrs | 1094 (9%) | 8415 (10%) | 23602 (12%) | |
60-69 Yrs | 650 (5%) | 6315 (7%) | 16927 (8%) | |
70+ Yrs | 415 (3%) | 3614 (4%) | 9691 (4%) | |
Median HH Income | $35,541 | $40,298 | $43,408 | |
Total Household Income | < 24K | 1364 (34%) | 8072 (29%) | 17893 (27%) |
25-49K | 1208 (30%) | 8514 (30%) | 19695 (29%) | |
50-74K | 819 (20%) | 5842 (21%) | 13613 (20%) | |
75-99K | 280 (7%) | 2835 (10%) | 7378 (11%) | |
100-199K | 257 (6%) | 2158 (7%) | 6644 (10%) | |
200K+ | 32 (0%) | 219 (0%) | 614 (0%) | |
Highest Education Level | No Diploma | 1306 | 8726 | 20222 |
Diploma or GED | 2257 | 17140 | 42151 | |
Some College | 1214 | 11163 | 27410 | |
Assoc. Degree | 699 | 4110 | 9943 | |
Bachelors Degree | 618 | 5238 | 13670 | |
Higher Degree | 315 | 2087 | 6301 | |
Total Housing Units | 4,557 | 31,404 | 74,401 | |
--Owner-Occupied | 863 | 9,078 | 27,147 | |
--Renter-Occupied | 3,098 | 18,562 | 38,689 | |
Owner-Occupied Values | < 100K | 646 | 5418 | 14562 |
100-199K | 178 | 3164 | 10502 | |
200-299K | 37 | 322 | 1446 | |
300-399K | 0 | 31 | 263 | |
400-499K | 2 | 50 | 121 | |
500K+ | 0 | 94 | 253 | |
Total Working Age Population | 7,873 | 59,632 | 146,001 | |
In Work Force | 5,759 | 40,211 | 96,400 | |
Not In Work Force | 2,114 | 19,420 | 49,601 | |
Workforce Employed | 5,314 | 36,913 | 88,074 | |
Workforce Unemployed | 445 | 3,229 | 8,195 | |
Civlian Workforce | 5,759 | 40,142 | 96,269 | |
Military Workforce | 0 | 70 | 130 | |
Total Households | 3,960 | 27,640 | 65,836 | |
Family Households | 2,636 | 17,610 | 41,933 | |
Non-Family Households | 1,324 | 10,030 | 23,903 | |
Married Couple | 947 | 7,862 | 19,511 | |
Other Family | 1,689 | 9,749 | 22,421 | |
Married w/Child | 373 | 3,611 | 8,879 | |
Single Male w/Child | 272 | 1,079 | 2,122 | |
Single Female w/Child | 1,063 | 4,540 | 9,280 |
Population Change Last Two Decades - Plus Projection
2000 | % | 2010 | % | 2020 | % | 2030 | |
---|---|---|---|---|---|---|---|
Georgia | 8,186,453 | +18 | 9,687,653 | +12 | 10,833,472 | +13 | 12,292,423 |
Clayton County | 236,517 | +10 | 259,424 | +18 | 304,838 | +22 | 373,234 |
DeKalb County | 665,865 | +4 | 691,893 | +15 | 793,154 | +19 | 944,045 |
Fayette County | 91,263 | +17 | 106,567 | +10 | 117,544 | +17 | 137,595 |
Fulton County | 816,006 | +13 | 920,581 | +19 | 1,099,181 | +18 | 1,300,861 |
Henry County | 119,341 | +71 | 203,922 | +18 | 239,866 | +20 | 286,950 |
Total Working Age Population:
Total Households:
Total Working Age Population:
Total Households:
Total Working Age Population:
Total Households: