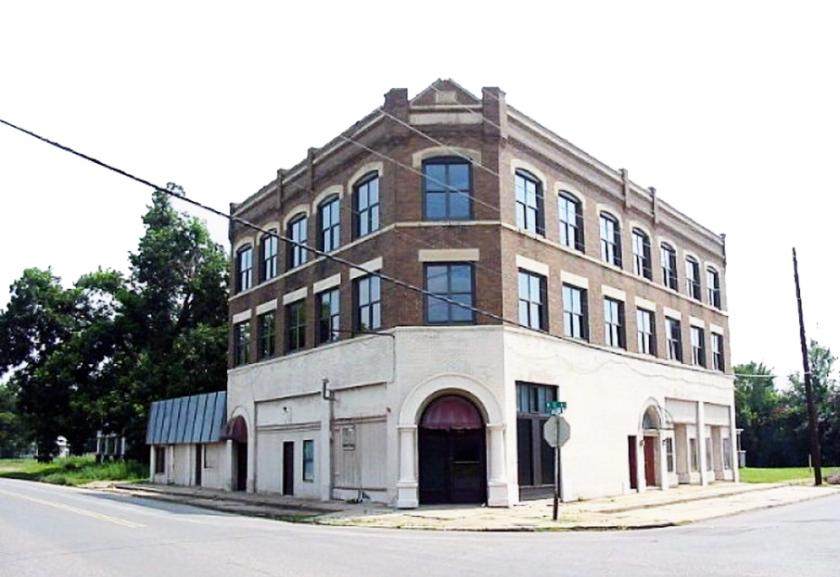
Multifamily Housing
400 North C Street Muskogee, OK 74403
400 North C Street Muskogee, OK 74403

Details & Description
Property Highlights
- • Mixed-use property
- • Floors 2-3 loft studio apartments
- • Retail ground floor
- • Former hotel with 15 rooms
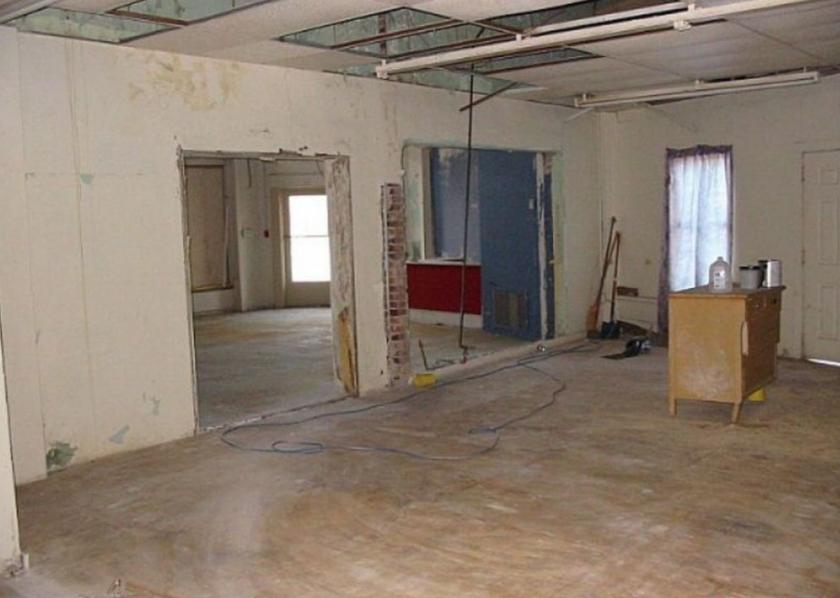
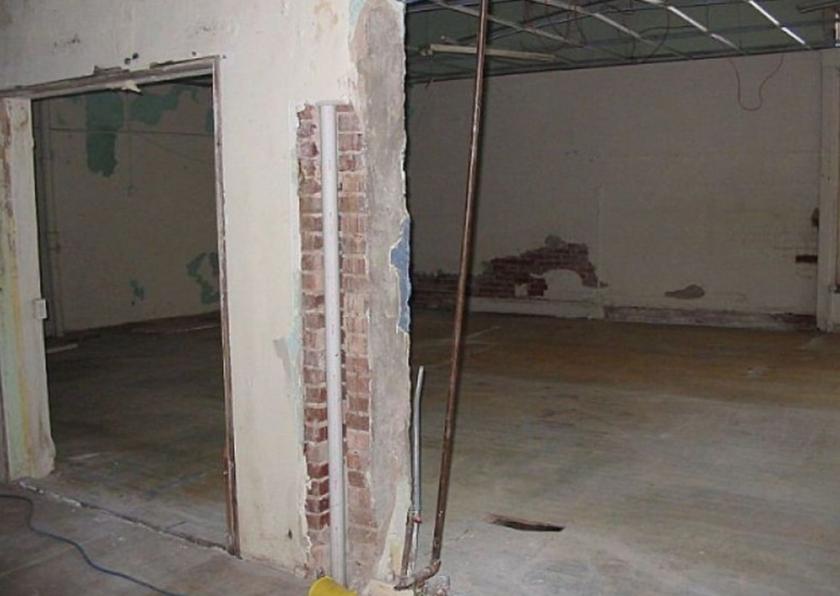
Additional Photos

Listing Agents

Cara Leigh Ingram
O: 918-376-1216
M: 214-213-3233
cingram@mcgrawcp.com
O: 918-376-1216
M: 214-213-3233
cingram@mcgrawcp.com
While we strive to provide the most accurate information, all listing information, and demographic data, is provided by third-parties. As such, MyEListing will not be responsible for the accuracy of the information. It is strongly recommended that you verify all information with the listing agent, and any relevant agencies, prior to making any decisions.


