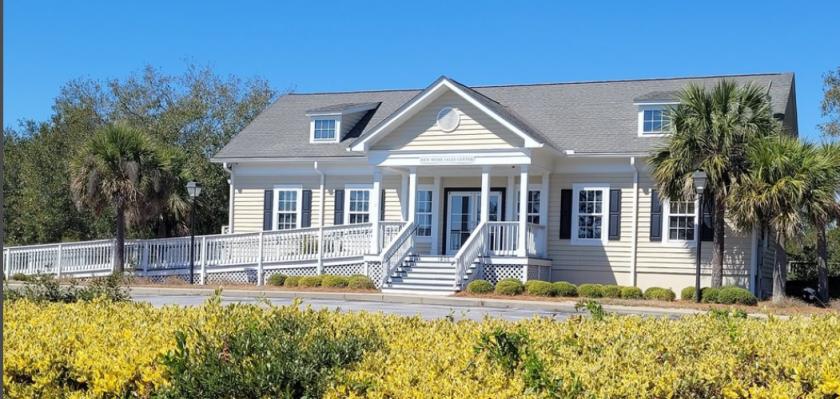
Commercial Land
1900 Seabrook Island Road Seabrook Island, SC 29455
1900 Seabrook Island Road Seabrook Island, SC 29455
Details & Description
Property Highlights
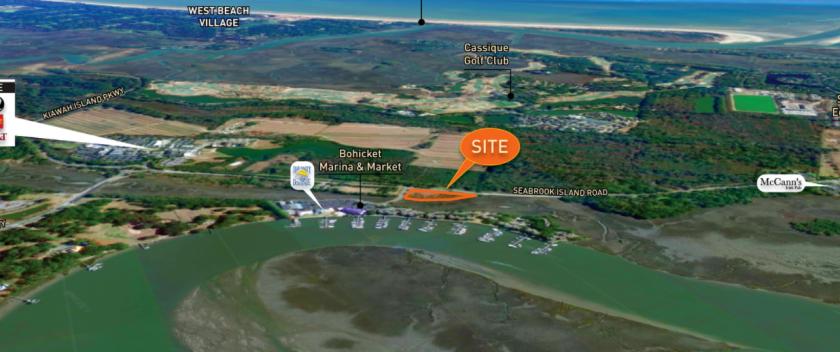
• Located outside the gates of Seabrook Island at the entrance to the soon to be redeveloped and expanded Bohicket Marina
• A half mile from the entrance to world class Freshelds Village and close proximity to the regions best golf courses
Listing Agents

Jeff Yurfest
O: 843-723-3054
jeff.yurfest@tscg.com
O: 843-723-3054
jeff.yurfest@tscg.com
While we strive to provide the most accurate information, all listing information, and demographic data, is provided by third-parties. As such, MyEListing will not be responsible for the accuracy of the information. It is strongly recommended that you verify all information with the listing agent, and any relevant agencies, prior to making any decisions.