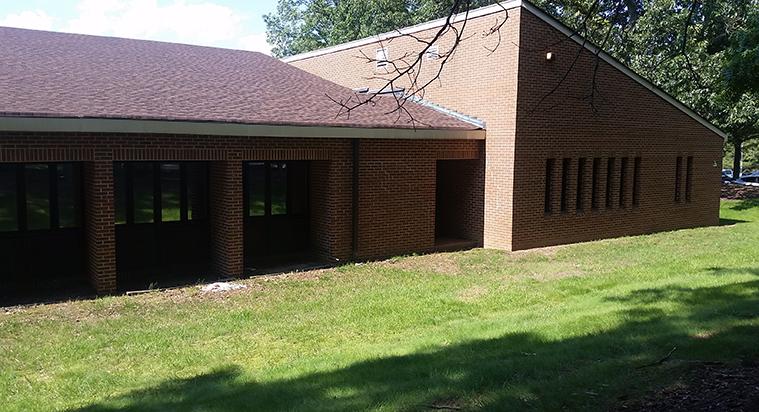
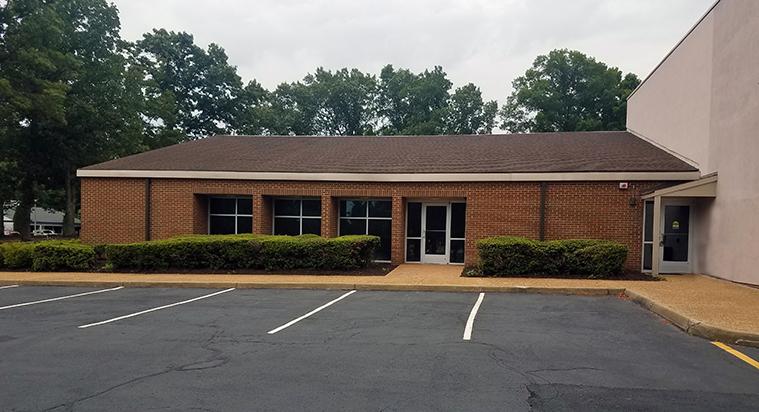
1-Mile | 3-Miles | 5-Miles | ||
---|---|---|---|---|
Total Population | 4,901 | 56,606 | 132,168 | |
Population Median Age | 40 | 41 | 40 | |
Population by Age | 0-9 Yrs | 513 (10%) | 6117 (10%) | 15452 (11%) |
10-19 Yrs | 610 (12%) | 7948 (14%) | 17203 (13%) | |
20-29 Yrs | 579 (11%) | 5443 (9%) | 14820 (11%) | |
30-39 Yrs | 821 (16%) | 7361 (13%) | 17267 (13%) | |
40-49 Yrs | 544 (11%) | 7653 (13%) | 17015 (12%) | |
50-59 Yrs | 799 (16%) | 7894 (13%) | 18815 (14%) | |
60-69 Yrs | 641 (13%) | 7977 (14%) | 17268 (13%) | |
70+ Yrs | 395 (8%) | 6214 (10%) | 14330 (10%) | |
Median HH Income | $76,811 | $87,543 | $81,297 | |
Total Household Income | < 24K | 183 (9%) | 1573 (7%) | 5535 (10%) |
25-49K | 375 (19%) | 3667 (16%) | 9480 (18%) | |
50-74K | 408 (20%) | 4038 (18%) | 8821 (17%) | |
75-99K | 274 (13%) | 3206 (14%) | 7001 (13%) | |
100-199K | 625 (31%) | 7243 (33%) | 15074 (29%) | |
200K+ | 106 (5%) | 2046 (9%) | 5289 (10%) | |
Highest Education Level | No Diploma | 158 | 2003 | 6265 |
Diploma or GED | 785 | 7675 | 17887 | |
Some College | 952 | 8182 | 18266 | |
Assoc. Degree | 208 | 2678 | 6794 | |
Bachelors Degree | 887 | 11593 | 26118 | |
Higher Degree | 529 | 7678 | 17541 | |
Total Housing Units | 2,093 | 23,006 | 54,426 | |
--Owner-Occupied | 1,259 | 17,262 | 37,178 | |
--Renter-Occupied | 712 | 4,511 | 14,021 | |
Owner-Occupied Values | < 100K | 25 | 603 | 1169 |
100-199K | 464 | 4220 | 9442 | |
200-299K | 514 | 7203 | 13183 | |
300-399K | 133 | 3045 | 5882 | |
400-499K | 100 | 1293 | 3704 | |
500K+ | 24 | 896 | 3798 | |
Total Working Age Population | 4,022 | 45,708 | 105,873 | |
In Work Force | 2,857 | 30,987 | 71,509 | |
Not In Work Force | 1,164 | 14,721 | 34,364 | |
Workforce Employed | 2,726 | 29,756 | 68,250 | |
Workforce Unemployed | 125 | 1,175 | 3,022 | |
Civlian Workforce | 2,851 | 30,931 | 71,273 | |
Military Workforce | 6 | 56 | 236 | |
Total Households | 1,971 | 21,772 | 51,199 | |
Family Households | 1,267 | 15,404 | 34,761 | |
Non-Family Households | 704 | 6,368 | 16,438 | |
Married Couple | 944 | 12,216 | 26,785 | |
Other Family | 323 | 3,189 | 7,976 | |
Married w/Child | 348 | 4,774 | 10,310 | |
Single Male w/Child | 34 | 397 | 951 | |
Single Female w/Child | 105 | 1,103 | 3,144 |
Population Change Last Two Decades - Plus Projection
2000 | % | 2010 | % | 2020 | % | 2030 | |
---|---|---|---|---|---|---|---|
Virginia | 7,078,515 | +13 | 8,001,024 | +8 | 8,655,021 | +8 | 9,331,666 |
Amelia County | 11,400 | +11 | 12,690 | +3 | 13,088 | +5 | 13,792 |
Chesterfield County | 259,903 | +22 | 316,236 | +12 | 353,841 | +12 | 396,647 |
Goochland County | 16,863 | +29 | 21,717 | +8 | 23,547 | +13 | 26,702 |
Hanover County | 86,320 | +16 | 99,863 | +9 | 109,244 | +9 | 119,360 |
Henrico County | 262,300 | +17 | 306,935 | +8 | 332,103 | +9 | 363,259 |
Powhatan County | 22,377 | +25 | 28,046 | +7 | 29,909 | +12 | 33,440 |
Richmond city | 197,790 | +3 | 204,214 | +14 | 232,533 | +6 | 245,483 |
Total Working Age Population:
Total Households:
Total Working Age Population:
Total Households:
Total Working Age Population:
Total Households: